
Most LinkedIn analytics tools are built to make you feel good about your content. They are not built to tell you whether your content is reaching the people who buy.
That distinction is the entire problem.
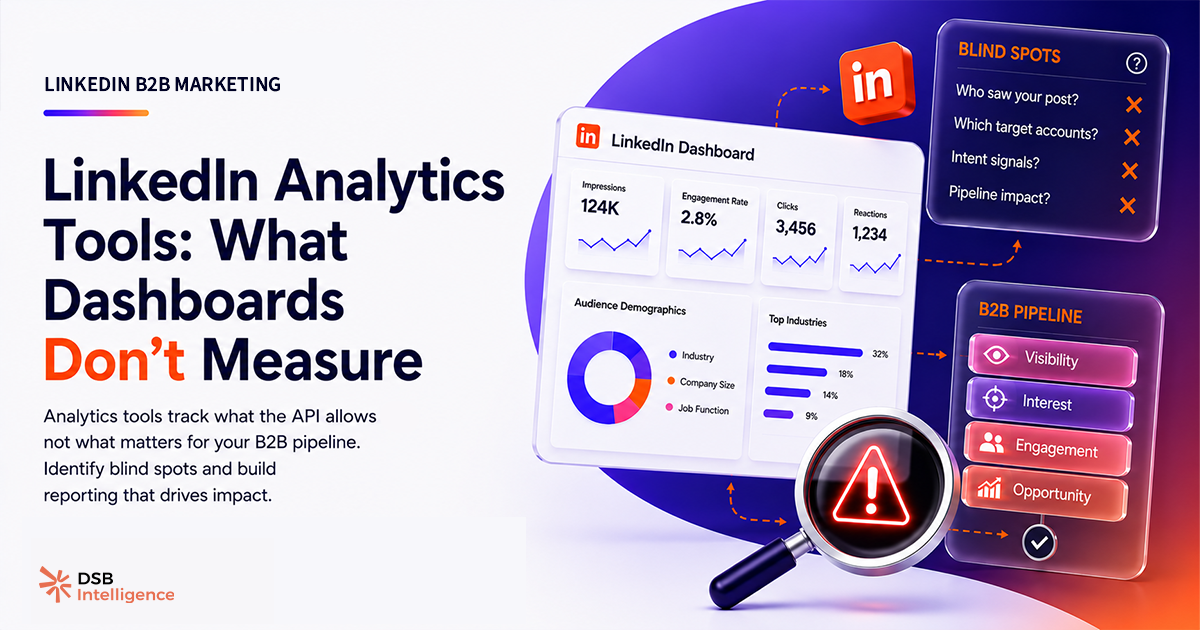
What do LinkedIn analytics tools actually track in 2026?
The core metric set across every major LinkedIn analytics tool — native or third-party — covers impressions, reactions, comments, shares, click-through rate, follower count, and follower growth rate. In our read of the market, this set has barely evolved since 2021.
These are activity metrics. They confirm that something happened. They do not confirm that the right people were involved.
Native LinkedIn analytics (available free inside the platform) gives you post-level breakdowns and a basic audience demographic tab. It's useful for a quick sanity check. It is not a B2B reporting tool. The demographic data is aggregated, delayed, and unavailable at the individual post level for most accounts.
Third-party linkedin analytics tools — Shield, Inlytics, and others — layer on historical trend lines, content calendars, and comparative benchmarks. Some add team-level reporting. The core data feed is still LinkedIn's API, which means the underlying metrics are the same. The difference is presentation and retention depth, not signal quality.
The ceiling of what any tool can surface is set by what LinkedIn exposes through its API. And LinkedIn does not expose individual viewer identity. That is the hard constraint every tool operates under.
Why does the standard LinkedIn analytics dashboard miss what B2B teams need?
B2B content strategy has one job: put the right message in front of the right decision-makers, often enough that they think of you when the problem becomes urgent.
That job requires knowing who is in your audience, not just how many. A post with 10,000 impressions from a mix of students, job-seekers, and peers in your own industry is not the same as 1,200 impressions from VP-level buyers at companies in your target segment. The impression count is the only number most dashboards show.
Three signals that actually matter for B2B go largely unreported.
ICP reach ratio — what share of your views came from job titles and company profiles that match your ideal customer profile. Without this, you're optimising for reach without knowing if it's the right reach. You can read more about this framing in LinkedIn Analytics Tools: Measure ICP Reach, Not Vanity.
Content-decay rate — how fast a post loses distribution after the initial push. In our view, a post that holds distribution past day four is getting algorithmic amplification — a signal that the content resonated with a specific audience cluster. No native tool surfaces this curve. It requires pulling time-stamped impression data and plotting it manually, or using a tool that does it for you. Understanding What Are LinkedIn Impressions — and What They Miss is the prerequisite for reading this curve correctly.
Repeat-viewer rate — the proportion of impressions that come from accounts that have seen your content before. High repeat-viewer rate with low ICP reach means you're building a loyal audience of the wrong people. High repeat-viewer rate with strong ICP overlap means you're building a shortlist position with real buyers.
These three signals are what LinkedIn for B2B Marketing: Fix the Scoreboard First calls the "scoreboard problem": teams optimise for the metrics they can see, not the ones that predict revenue.
How does audience segmentation separate useful tools from noise?
The single most important differentiator between linkedin analytics tools in 2026 is whether they segment audience data by seniority and company size — at the post level, not just the profile level.
LinkedIn's native demographic tab shows follower demographics for your overall page or profile. It does not show you which specific posts reached senior buyers versus junior practitioners. That granularity is what B2B teams need to make content decisions.
A few third-party tools have started building ICP-filtering layers on top of LinkedIn's API data. The approach varies: some use job-title keyword matching, others use company-size inference from firmographic databases. None have perfect coverage, because LinkedIn does not release viewer-level data.
DSB Intelligence's Insight Narrator is designed around this exact gap — the goal is to surface when a post's distribution skews away from your ICP, so you can adjust format or topic before the next cycle rather than after a quarter of wasted output.
The practical test for any tool: can it answer "which of my last 10 posts reached the highest share of director-level and above at companies with more than 200 employees?" If the answer requires a manual export and a pivot table, the tool is not built for B2B reporting.
What does connecting LinkedIn content performance to pipeline actually require?
Most B2B teams want the same thing: a line from "we posted this" to "this deal moved." That line is hard to draw, and most linkedin analytics tools stop well before the CRM.
The connection requires two things most tools don't provide together.
First, audience-level signals — not just engagement counts, but some indication of which company profiles or job-title clusters engaged. Even without individual identity (which LinkedIn doesn't release), company-level engagement patterns can be matched against CRM account lists. If a post about enterprise procurement drove above-average engagement from accounts already in your pipeline, that's a signal worth capturing. This is also where LinkedIn Lead Generation: 4 Intent Signals That Build Pipeline picks up — mapping content engagement to account-level intent before a conversation even starts.
Second, content attribution logic — a way to tag which posts a prospect saw before they converted, requested a demo, or replied to an outbound sequence. This requires either UTM discipline on linked content or a tool that timestamps content exposure against CRM activity. Most teams have neither in place.
The gap between "we got good engagement" and "this content contributed to pipeline" is a data infrastructure problem, not a content quality problem. Solving it starts with knowing When Is the Best Time to Post to LinkedIn — because timing shapes which audience segment is active when your post lands, and that affects every downstream signal.
Now what?
Start with an audit. Pull your last 20 posts and check whether your analytics tool can tell you the seniority breakdown of viewers — at the post level, not the profile level. If it can't, you're flying blind on audience quality.
Then define your ICP filter explicitly. Job titles, seniority levels, company size ranges — write them down before you evaluate any tool. A tool that can't be configured against your specific ICP is a creator tool, not a B2B tool.
Next, build a proxy for pipeline connection. Even without direct CRM integration, you can cross-reference high-engagement posts against accounts in your pipeline manually, once a month. It's imperfect, but it's better than optimising for impressions alone.
Finally, test your tool against the practical question: "which of my last 10 posts reached the most director-level buyers at target accounts?" If the answer takes more than two clicks, you have your answer about the tool.
Start a free trial of DSB Intelligence and run that test on your own content data.