

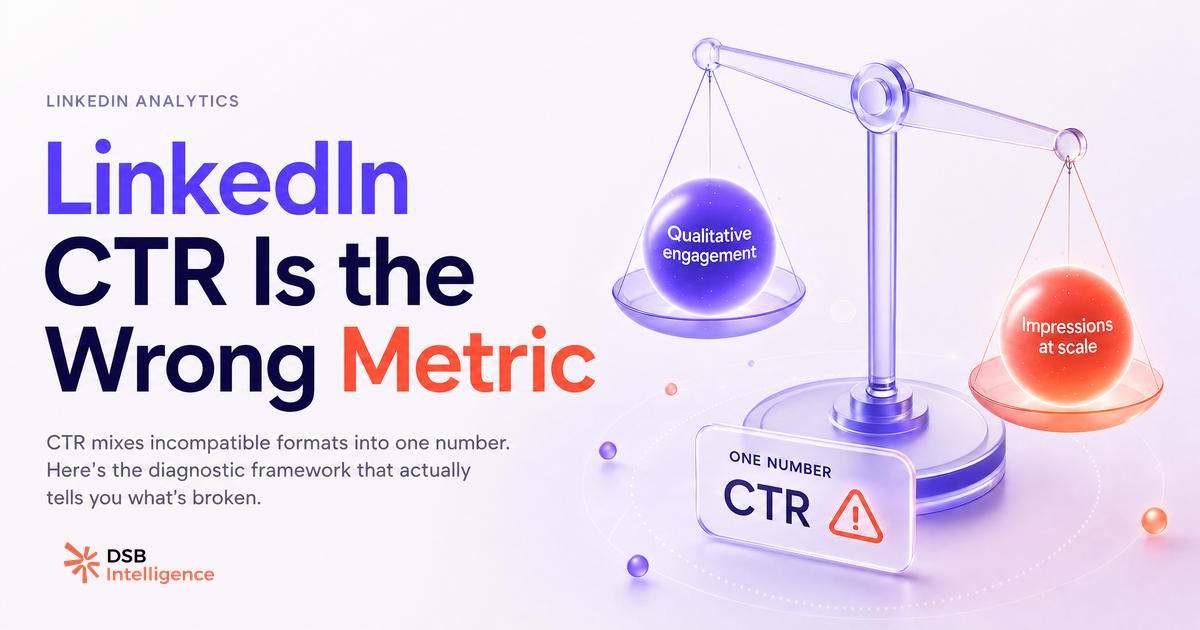
Optimizing your LinkedIn click-through rate is one of the most common mistakes in B2B content strategy. Not because clicks don't matter — they do. Because CTR, as most teams measure it, is a ratio built on incompatible inputs.
Are most LinkedIn CTR numbers averages of incompatible content types?
Yes, and that's the core problem. When a benchmark report says "the average LinkedIn CTR is X%," it almost always aggregates link posts, text posts, document carousels, video posts, and newsletter promotions into a single number.
These formats are structurally different. A link post invites a click by design — the preview card is a visual affordance that signals "leave the feed." A text post or a carousel has no such affordance. Comparing their CTRs is like comparing the conversion rate of a landing page to the conversion rate of a billboard.
The denominator compounds the problem. Impressions on LinkedIn are not a neutral count of eyeballs. They reflect the algorithm's early distribution decision: who saw the post, how warm that audience is, and how much of the feed was competing for attention at that moment. Two identical posts published at different times to different audience segments will produce different CTRs without any change in content quality.
This is why chasing a benchmark — "we need to hit 2% CTR" — is a strategy built on a shaky foundation. The number is real, but what it measures is too noisy to act on in isolation. If you're thinking about amplifying posts that already show organic traction, the mechanics behind LinkedIn Thought Leadership Ads: the Organic-to-Paid Bridge are worth reading before you set CTR as your paid optimization target.
What does a low LinkedIn CTR actually signal — and when does it mean nothing?
A low CTR means nothing when the post was never designed to generate a click. That sounds obvious. In practice, most LinkedIn analytics dashboards surface CTR for every post regardless of format intent, which creates a false urgency to "fix" posts that are working exactly as intended.
A thought leadership post that builds credibility, earns comments, and gets saved has done its job even if zero people clicked a link — because there was no link. Measuring its CTR is a category error.
A low CTR becomes a real signal in two specific situations. First: a link post with high impressions and low CTR, where the audience saw the preview card and chose not to click. That's a hook or relevance problem. Second: a post that received strong early engagement (reactions, comments) but generated no clicks on an embedded link. That's a content-to-CTA mismatch — the audience liked the post but didn't trust or want the destination.
The distinction matters because the fixes are different. A hook problem is solved at the copy level. A CTA mismatch is solved by rethinking the offer or the audience segment, not the writing.
Does the impressions-to-dwell ratio matter more than impressions-to-click?
For most organic LinkedIn content, yes. Dwell time — the time a viewer spends with a post before scrolling — is a signal that LinkedIn's feed likely weighs when deciding whether to extend distribution. A post that holds attention without generating a click is still feeding a positive signal into the system.
The ratio that reveals the most is the relationship between these two numbers across a post's lifetime. In the first few hours after publishing, impressions accumulate fast. Dwell time accumulates more slowly and more honestly — it reflects genuine attention, not algorithmic reach.
A post with a high impressions-to-dwell ratio (many views, little time spent) is getting skipped. That's a content problem: the hook didn't earn the scroll-stop. A post with a low impressions-to-dwell ratio (fewer views, but sustained attention) is doing awareness work efficiently. Adding a link to that post in a follow-up comment is a reasonable next step.
For context on how format choices shape dwell behavior, Video Format for LinkedIn in 2026: What Actually Matters covers how video's autoplay mechanic inflates dwell artificially — which is worth accounting for when you benchmark across formats.
How does Insight Narrator read your click pattern to separate distribution problems from content problems?
The distinction between a distribution problem and a content problem is the most useful diagnostic frame in LinkedIn analytics — and it's the one most teams skip because their dashboard doesn't surface it.
A distribution problem looks like this: impressions plateau within the first 12 to 24 hours, engagement rate is decent among those who saw it, but the post never got a second wave. The content was fine; the algorithm didn't extend it. The fix is upstream: posting time, hashtag relevance, or seeding engagement in the first hour. How to Add Hashtags to a LinkedIn Post in 2026 covers the hashtag side of that equation.
A content problem looks different: impressions are healthy, the post reached a broad audience, but CTR and dwell are both flat. The audience saw it and moved on. That's a relevance or quality signal, not a reach signal.
DSB Intelligence's Insight Narrator is built to surface exactly this split. It reads the click pattern across your post history — not just the CTR number, but the shape of how clicks and impressions accumulate over time — and flags whether a post underperformed because of how it was distributed or because of what it said. That distinction changes the action you take next.
What does a four-week diagnostic look like to stop chasing CTR?
Four weeks gives you enough posts across enough formats to separate structural patterns from one-off variance. Here's how to run it without overcomplicating it.
Week 1: Audit your last 20 posts. For each, note the format (link, text, document, video), the impressions in the first 24 hours, and the CTR. Don't draw conclusions yet — you're building the dataset.
Week 2: Add dwell time data where your analytics tool surfaces it. Group posts by format. Calculate average CTR and average dwell per format group separately. You'll likely see that your "low CTR" posts are concentrated in one format, not spread evenly.
Week 3: For the two or three posts with the highest impressions and lowest CTR, look at the comment and reaction pattern. High reactions, low clicks = CTA mismatch. Low reactions and low clicks = hook or distribution problem. These are different problems.
Week 4: Run one controlled test. Take the format with the strongest dwell-to-impression ratio and add a single clear CTA — either in the post or in the first comment. Measure whether CTR moves without dwell dropping. If dwell drops when CTR rises, you've found the tension point in your content strategy.
This diagnostic also applies cleanly to event-driven content. If you're using LinkedIn events as a pipeline trigger, LinkedIn Events as a Pipeline Trigger: What Works shows how click patterns on event posts differ from standard content posts — the intent signal is stronger, which changes how you interpret a "low" CTR.
Now what?
- Pull your last 20 posts and separate them by format before you look at any CTR number. Aggregated CTR across formats is noise.
- Add dwell time to your tracking. If your current tool doesn't surface it, that's a gap worth closing — it's the signal that separates attention from reach.
- Run the four-week diagnostic above. Commit to not changing your content strategy until week four. Reacting to week-one data is how teams end up optimizing for the wrong thing.
- If you want to see how your click pattern maps to distribution vs. content problems without building the analysis manually, start a free trial of DSB Intelligence — Insight Narrator runs this diagnostic on your account automatically.