
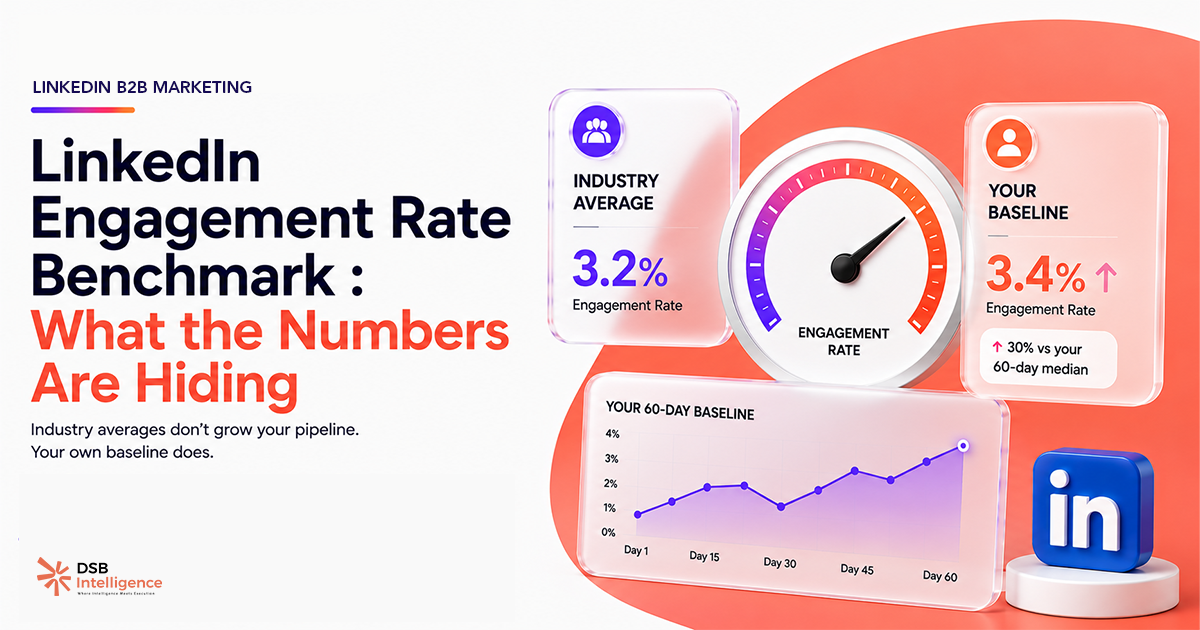
The benchmark everyone quotes — "aim for 2% engagement rate on LinkedIn" — comes from aggregated data that was never designed to guide your content decisions.
It's not wrong because the math is off. It's wrong because the inputs are incoherent.
Why is the LinkedIn engagement rate benchmark so hard to trust?
The core problem is definitional. Engagement rate on LinkedIn is not a standardized metric. LinkedIn itself calculates it one way in its native analytics. Third-party tools each pick their own formula. Some count reactions only. Others add comments. Others fold in clicks, shares, and follows. A few include impressions from outside the platform (newsletter opens, external embeds).
When a report says "the average LinkedIn engagement rate is 2.1%," you have no idea which formula produced that number — or whether it matches the formula your own tool uses. The comparison is structurally broken before you even look at the data.
The second problem is the account pool. Benchmarks aggregate personal profiles alongside company pages, nano-creators alongside enterprise accounts with hundreds of thousands of followers. Engagement rate is not scale-invariant. A personal profile with 800 followers routinely sees engagement rates above 5% — because followers self-selected hard and the algorithm rewards tight communities. A company page with 80,000 followers operates in a different distribution entirely. Averaging the two produces a number that describes neither.
If you want to understand what LinkedIn post impressions actually measure and where they fall short, the denominator problem is just as real as the numerator one.
Does LinkedIn engagement rate by industry actually mean anything?
Industry-cut benchmarks are a layer of false precision on top of an already noisy metric.
The logic sounds reasonable: compare yourself to peers in your vertical. But "B2B technology" as a LinkedIn category includes a bootstrapped SaaS founder posting daily thought leadership, a 500-person enterprise software company running a content team, and a VC firm sharing portfolio news twice a month. Their audience compositions, posting cadences, and content formats are incomparable. The industry label is not a meaningful control variable.
There's also a survivorship issue. The accounts that show up in benchmark datasets are typically those already using analytics tools — which skews toward more active, more optimized accounts. The median account in your industry is probably less engaged than the benchmark suggests, because the least active accounts are underrepresented in the data.
What you can do instead: use industry benchmarks as a rough orientation, not a target. If your engagement rate is an order of magnitude below the published figure for your vertical, that's a signal worth investigating. If you're within the same range, the benchmark has told you nothing useful.
What does the impressions-to-engagement ratio actually tell you?
The impressions-to-engagement ratio — the share of impressions that triggered at least one action — is a distribution metric, not a quality metric.
Here's the distinction that matters: a post seen by 10,000 people who have no reason to care about your product will always underperform a post seen by 500 decision-makers who are actively evaluating solutions in your category. The ratio captures resonance within the reached audience. It says nothing about whether that audience was worth reaching.
This is why LinkedIn organic reach benchmarks can be misleading without an audience quality layer. A post that "goes viral" in the wrong community inflates your impressions-to-engagement ratio while generating zero pipeline signal.
For B2B teams, the question is not "what percentage of people who saw this post engaged?" It's "which people engaged, and are they in my ICP?" Those are different questions. The first one is what benchmarks answer. The second one is what matters.
DSB Intelligence's Insight Narrator is built around exactly this distinction: instead of surfacing a raw engagement rate, it breaks down who engaged — by seniority, company size, and industry — so you can tell whether a post's performance was signal or noise.
How should B2B teams set their own LinkedIn performance benchmarks?
Build your benchmark from your own data, segmented by format and measured over a rolling 90-day window.
Start with format separation. Carousel posts, text-only posts, video posts, and document posts have structurally different engagement distributions on LinkedIn. Averaging across formats produces the same problem as averaging across industries — you lose the signal in the noise. Track each format separately.
Then look at absolute numbers alongside rates. A 0.5% engagement rate on a post that reached 20,000 people represents 100 engaged users. A 5% rate on a post that reached 400 people represents 20. For B2B pipeline purposes, 100 engaged users from a broad audience may still be less valuable than 20 engaged users who are all VP-level buyers in your target segment. Rate alone doesn't tell you which scenario you're in.
Finally, set your benchmark from your trailing 90 days, not from a published report. Your account's history is the only dataset that controls for your audience composition, your posting cadence, and your content mix. A post that beats your 90-day average is a signal worth understanding. A post that beats an industry benchmark published by a tool vendor is a press release, not an insight.
For a fuller picture of which metrics actually connect to pipeline, LinkedIn for B2B Marketing: Fix the Scoreboard First walks through the measurement stack that B2B teams consistently underuse.
Why do most LinkedIn analytics tools reinforce the wrong benchmarks?
Because benchmarks are a product feature, not a research output.
Tools that show you "you're above the industry average" create a positive feedback loop that keeps users engaged with the dashboard. It's a retention mechanic dressed as an insight. The benchmark number is often calculated from the tool's own user base — which, as noted above, skews toward active, optimized accounts — and presented without methodology disclosure.
This doesn't mean the tools are useless. It means you should treat their benchmark figures the way you treat a vendor's case study: directionally interesting, not operationally binding.
The better use of a LinkedIn analytics tool is to track your own trends over time, identify which formats and topics drive engagement from your ICP, and correlate content performance with downstream pipeline signals. That requires choosing tools built for B2B analytics, not vanity metrics.
Posting timing also interacts with engagement rate in ways most benchmarks ignore entirely — a post published when your ICP is offline will underperform regardless of content quality. When Is the Best Time to Post to LinkedIn covers the audience-specific timing logic that aggregate benchmarks can't capture.
Now what?
- Audit your benchmark source. Check how your current tool defines engagement rate. If it doesn't disclose the formula, the number is uninterpretable.
- Separate your data by format. Pull your last 90 days of posts, split by format (text, carousel, video, document), and calculate your own average engagement rate per format. That's your real benchmark.
- Add an audience quality filter. For your top 10 posts by engagement, check who actually engaged. Are they in your ICP? If not, high engagement rate is a vanity metric for your account specifically.
- Stop comparing to industry averages. Use them as a rough sanity check, not a target. Your 90-day rolling average by format is the only benchmark that controls for your actual situation.
Ready to see engagement broken down by who's actually engaging — not just how many? Start a free trial of DSB Intelligence and run your first ICP-filtered performance report in under five minutes.