

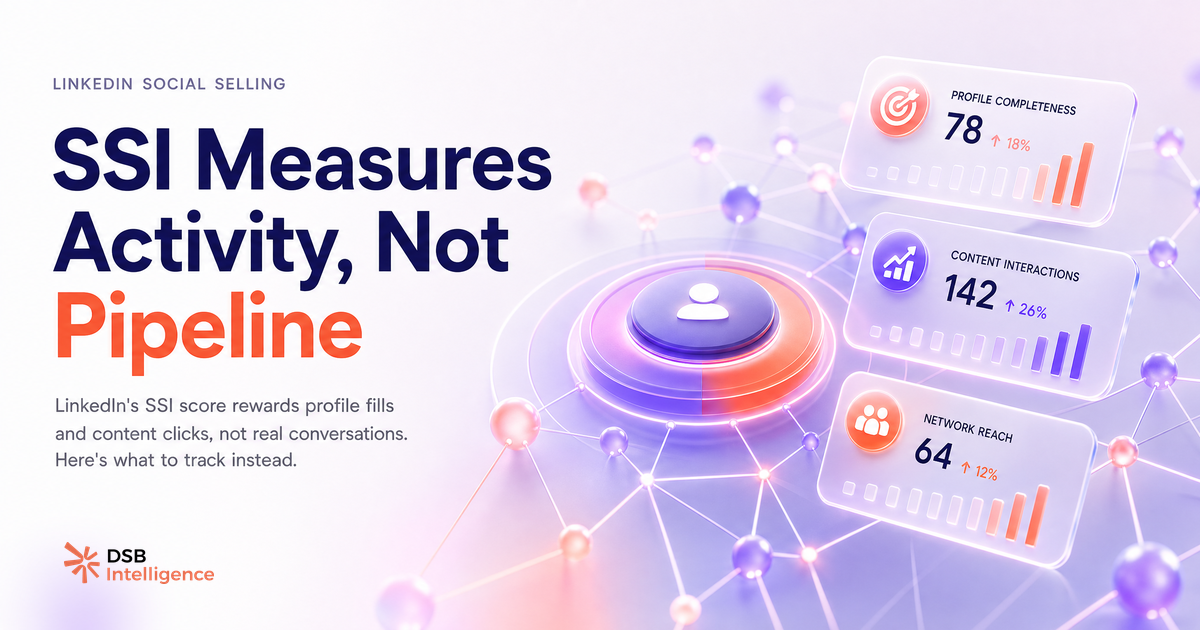
A high LinkedIn SSI score is one of the most reliably misleading metrics in B2B sales. Not because the score is broken, but because teams use it as a proxy for something it was never designed to measure.
What does the LinkedIn Social Selling Index actually measure, and which of its four components do people most often misread?
SSI is a 0-100 composite built from four equally-weighted pillars, each worth 25 points. LinkedIn defines them as: establishing your professional brand, finding the right people, engaging with insights, and building relationships.
The problem is in the equal weighting. A rep who fills out every profile section, posts three times a week, and sends 40 connection requests to cold prospects can score above 70 without a single substantive sales conversation. The "engaging with insights" pillar rewards sharing and reacting to content, not the quality of the exchanges that follow. The "building relationships" pillar counts connection growth and InMail activity, not whether those connections ever replied.
The component most people misread is "finding the right people." It measures how actively you use LinkedIn's search and lead-saving features, particularly inside Sales Navigator. It does not measure whether the people you find are actually in your ICP, whether they have budget, or whether they are in an active buying cycle. Activity is not intent.
The second most misread pillar is "establishing your professional brand." It rewards profile completeness and content publishing frequency. A founder who posts daily thought-leadership content but never converts a follower into a meeting will score well here. A quiet operator who books two enterprise calls a week from targeted DMs will score poorly. The score cannot tell the difference.
Why doesn't a good SSI score predict pipeline, and where is the data gap?
The data gap is structural. LinkedIn built SSI to encourage platform adoption, not to serve as a sales performance indicator. The score has no access to your CRM, no visibility into whether an InMail led to a booked call, and no way to distinguish a meaningful comment thread from a string of emoji reactions.
LinkedIn has published claims that high-SSI sellers outperform low-SSI sellers on quota attainment. Those figures appear in their own marketing materials, not in peer-reviewed research or independently audited datasets. The direction of causality is also unclear: high performers may use LinkedIn more actively because they are already good at sales, not the other way around.
For a deeper look at how profile-level signals can mislead without proper context, Profile Views on LinkedIn Tell You Almost Nothing Alone walks through the same structural problem from a different angle.
The practical consequence: if your team reports SSI as a KPI in a sales review, you are measuring platform behavior, not commercial progress. The two can move in opposite directions.
Which signals actually correlate with real B2B outcomes, and which ones just inflate your score?
The signals that inflate SSI without moving pipeline are easy to identify. Publishing content daily, reacting to posts in your feed, saving leads in Navigator without outreach, and growing your connection count through broad requests all push the score up. None of them require a conversation.
The signals that tend to precede real pipeline are harder to track but more honest. InMail reply rates, particularly on cold outreach, are a direct measure of message relevance and targeting quality. Comment threads that extend beyond two exchanges indicate genuine interest. Connection requests accepted from second-degree contacts in a specific vertical suggest your positioning is landing. Dwell time on your posts, meaning the time a viewer actually spends reading rather than scrolling past, is a behavioral signal that content is resonating.
None of these appear in SSI. They require separate tracking.
This is where DSB Intelligence's Insight Narrator becomes relevant: it reads SSI alongside engagement depth and dwell time patterns to surface the gap between what your score says and what your content is actually doing in the feed. The score tells you you're active. The Narrator tells you whether that activity is building anything.
For context on how Sales Navigator metrics fit into this picture, LinkedIn Sales Navigator vs Premium: B2B Verdict covers which tier actually gives you actionable data and which one is mostly feature padding.
How should you use SSI as a diagnostic, not a target?
Treating SSI as a diagnostic means asking one question: does a low score reveal a structural gap, or is it just noise?
A score below 40 usually signals something broken at the foundation: an incomplete profile that reduces credibility before a prospect even reads your message, a dormant network that hasn't been touched in months, or zero content activity that leaves your profile looking abandoned. These are real problems worth fixing.
A score between 50 and 70 in most B2B verticals is functional. The profile works, the network is alive, and there is some content presence. At this level, optimizing further for SSI has diminishing returns. The right move is to shift attention to the metrics SSI cannot see.
Above 70, the score is essentially background noise. The energy that would go into pushing it to 85 is better spent analyzing which posts generated DM follow-ups, which connection sequences led to calls, and which content formats held attention long enough to matter. Hashtags on LinkedIn in 2026: Do They Still Matter? is a useful companion here: it applies the same diagnostic logic to another metric that gets over-optimized relative to its actual impact on reach.
The benchmark feature inside the SSI dashboard, which shows your score relative to your industry and network, is the one genuinely useful part of the tool. If your score sits 20 points below your industry median, that is a signal worth investigating. If it sits at the median or above, the benchmark has done its job and you can move on.
For a full breakdown of how SSI fits into a broader LinkedIn analytics framework, LinkedIn Social Selling Index: What It Measures vs. What It Predicts goes deeper on the methodology behind the score.
Now what?
- Pull your SSI score today at linkedin.com/sales/ssi. Note your weakest pillar. If it is below 15 out of 25, fix the structural gap (profile, network, or content cadence) before doing anything else.
- Set up a parallel tracking system for the signals SSI ignores: InMail reply rates, comment thread depth, and connection acceptance rates from your target vertical. A simple spreadsheet works. The point is to have a number that connects to pipeline.
- Run a 30-day experiment: hold your SSI constant (stop optimizing for it) and redirect that energy toward one high-quality outreach sequence per week. Compare the pipeline output to the previous 30 days.
- If your team is ready to go beyond manual tracking, start a free trial of DSB Intelligence to see how Insight Narrator surfaces the engagement patterns your SSI dashboard cannot show you.