

Your automated reporting setup is probably working fine. The data arrives on time, the dashboard looks clean, and the PDF exports without errors.
Then a client asks: "So what does this actually mean for our pipeline?" And the room goes quiet.
Does your automated reporting generate data — or decisions?
Most automated reporting tools are built to answer one question: "What happened?" They collect data reliably, format it consistently, and deliver it on schedule. That is genuinely useful. It is also nowhere near enough for a B2B client conversation.
Clients don't pay agencies to read numbers back to them. They pay for the interpretation: what changed, why it changed, and what to do next. When the tool stops at delivery and the account manager hasn't had time to analyze the output, the meeting becomes a live data-reading exercise. That is not a good use of anyone's time.
The problem is structural. Most automated reporting tools were designed for internal ops teams, not for client-facing agency workflows. They optimize for data accuracy and delivery speed. They don't optimize for the question a client asks at minute three of a call.
This is why agencies with sophisticated stacks still spend hours before every client review manually constructing a narrative around the numbers the tool produced. The automation saved the data-pull time. It didn't save the thinking time.
Where does the reporting pipeline actually break?
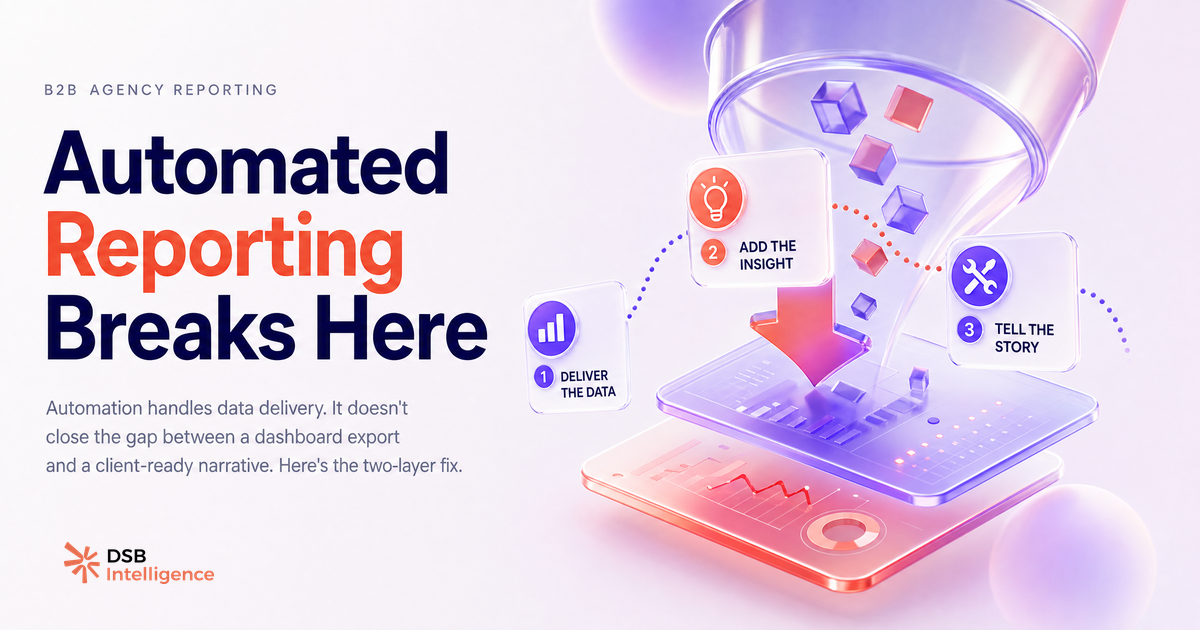
The break point is the gap between raw metrics and a client-ready narrative. It is almost always in the same place: between the dashboard export and the slide deck.
Here is the sequence that plays out in most agency workflows. The automated reporting tool pulls the data and formats it. An account manager opens the export, scans the numbers, and starts building a story. If a metric is down, they need to explain why. If a metric is up, they need to attribute it to a specific action. Neither explanation is in the export. Both require context that lives in the account manager's head, in the campaign notes, or in a separate analytics tool.
That context-gathering step is manual, inconsistent, and invisible in most agency workflows. It is also where the hours go. A team managing fifteen client accounts doesn't have fifteen hours of interpretation time before every reporting cycle. So they compress it. The narrative gets thin. The client gets a data summary dressed as a strategy update.
The downstream effect is worse than the time cost. When an account manager can't explain a metric shift confidently, the client starts questioning the whole engagement. Not because the numbers are bad, but because the agency looks like it doesn't understand them.
For B2B LinkedIn accounts specifically, this problem is sharper. LinkedIn's native analytics surface impressions, reactions, and follower counts. None of those metrics answer the question a B2B client actually cares about: "Are we reaching the right people, and is it moving the pipeline?" See LinkedIn Analytics Tools: What B2B Teams Actually Need for a breakdown of which signals actually map to pipeline outcomes.
How do you automate the reporting process without losing the interpretation layer?
The answer is to treat data collection and narrative generation as two separate problems that require two separate solutions.
Data collection, formatting, and scheduling are fully automatable. Any competent automated reporting tool handles this. The question is not whether to automate that layer — it is whether your tool stops there.
Narrative generation is different. It requires understanding what a metric shift means in context: which actions preceded it, what the benchmark is, and what the logical next step is. Until recently, that step required a human analyst. It still often does. But the gap is closing.
The practical architecture for an agency that wants to preserve interpretation at scale looks like this. First, automate the data pipeline completely: scheduled pulls, standardized formatting, consistent metric definitions across accounts. Second, build or adopt an interpretation layer that sits on top of the data and produces plain-language explanations of what changed and why. Third, keep a human in the loop for the final narrative judgment: the account manager reviews the AI-generated interpretation, adjusts for client context, and presents.
What this is not: a magic tool that replaces strategic thinking. What it is: a workflow that stops forcing every account manager to be an analyst before every client call.
One place this architecture is being built explicitly for LinkedIn analytics is DSB Intelligence's Insight Narrator, which reads metric patterns across a client's account and produces a plain-language interpretation of what shifted and why. The account manager gets a draft narrative, not a raw export. The interpretation layer is built into the workflow, not bolted on the night before the call.
What are the three reporting types that actually matter for B2B client accounts?
Most B2B agency reporting covers too many metrics and the wrong ones. Here is the filter that cuts the noise.
Reach-to-ICP ratio is the first metric that survives a CFO's first question. Total impressions are irrelevant if the audience is wrong. What matters is the share of content reach that lands on profiles matching the client's ideal customer profile: the right seniority, the right industry, the right company size. This is a LinkedIn-specific metric that native analytics doesn't surface cleanly, which is why most agency reports skip it. That is a mistake.
Content-to-pipeline attribution is the hardest to measure and the most important to attempt. Which posts, formats, or topics correlate with inbound connection requests from ICP-matching profiles? Which content types precede demo requests? The attribution is never perfect, but a directional answer is more useful than a follower count. See LinkedIn Analytics Tools: Measure ICP Reach, Not Vanity for the measurement approach.
Competitive share of voice tells the client whether they are gaining or losing ground in their category on LinkedIn. It is a relative metric, which makes it more actionable than an absolute one. A client whose impressions dropped 10% but whose share of voice held steady has a different problem than one whose impressions held but whose share of voice dropped.
The reporting type that wastes everyone's time: follower growth as a primary KPI. Follower counts are a lagging vanity metric. They tell you nothing about reach quality, content resonance, or pipeline impact. Every client deck that leads with follower growth is a deck that will struggle to justify the retainer at renewal.
What does manual vs. automated reporting actually cost at agency scale?
The time argument for automated reporting is well-established and not the most interesting one. Yes, pulling data manually across fifteen client accounts takes longer than scheduling an automated pull. That is not the point worth debating.
The more important cost is inconsistency. When reporting is manual, different account managers frame the same metric differently. One calls a 15% drop in impressions a "seasonal adjustment." Another flags it as a "performance issue requiring immediate action." The client experience diverges. The agency's strategic positioning diverges. Over several quarters, this inconsistency compounds into what looks like strategic drift: the agency appears to have no coherent point of view on what the numbers mean.
Automated reporting standardizes the baseline. Every account gets the same metric definitions, the same benchmarks, the same formatting. That consistency is worth more than the time saved on data pulls.
What automation hasn't standardized yet is the interpretation. That is the remaining manual cost, and it is the one that scales badly. An agency growing from ten to thirty client accounts doesn't triple its reporting time on data collection if the pipeline is automated. It does triple its interpretation time if there is no layer between the data and the narrative. That is the bottleneck that breaks agency growth, not the data pull.
For a broader view of how the agency stack fits together, Social Media Manager Tools: The Agency Stack That Works maps the tooling decisions that compound over time. And if you're evaluating LinkedIn-specific automation tools that feed into the reporting pipeline, Best LinkedIn Automation Tools: a Buyer's Framework and the Expandi LinkedIn Automation Tool: Honest Review are worth reading before committing to a stack.
The honest summary: automated reporting tools solve the data problem. They don't solve the interpretation problem. Agencies that conflate the two end up with faster noise, not faster insight.
Now what?
- Audit your current reporting workflow. Map where the manual interpretation step happens — it is almost certainly between the export and the deck. That is your actual bottleneck, not the data pull.
- Separate your metric set into three tiers: ICP reach, pipeline attribution, and competitive share of voice. Cut anything that doesn't survive the question "what decision does this metric inform?"
- Build or adopt an interpretation layer. Whether that is a dedicated analyst, a structured narrative template, or an AI-assisted tool, the layer needs to exist explicitly in the workflow before the client call, not during it.
- Standardize metric definitions across all client accounts before you automate anything. Automated reporting on inconsistent definitions produces consistently wrong comparisons.
If your agency manages LinkedIn-heavy B2B accounts and the interpretation gap is the bottleneck, try DSB Intelligence free and see what a reporting workflow with a built-in narrative layer looks like in practice.