

The monthly marketing report is the most sent, least read document in B2B agency relationships. Clients open it, scroll to the graph that looks worst, and email back with a question the report should have already answered.
That is not a client problem. That is a report design problem.
Does your marketing monthly report answer the wrong question?
Most reports are built around the question "what happened this month?" That is the wrong question. Clients already know something happened — they live with the results. What they need to know is: "should we change anything, and if so, what?"
The structural failure is inherited from dashboard culture. Agencies export everything the platform surfaces: impressions, clicks, CTR, conversions, cost per lead, quality score, engagement rate. The implicit message is "here is proof we were busy." The client's implicit response is "I don't know what to do with this."
A report structured around decision logic looks different. It leads with a verdict. It explains causality. It ends with a recommended action, not a list of observations.
The distinction matters commercially. Clients who understand their results renew. Clients who feel confused about their results churn — and they blame the agency, not their own comprehension. As the SEO Client Reporting Is Broken — Fix It Now analysis makes clear, the reporting layer is where agency relationships are won or lost, independently of actual campaign performance.
What are the 4 sections that make a marketing monthly report decision-ready?
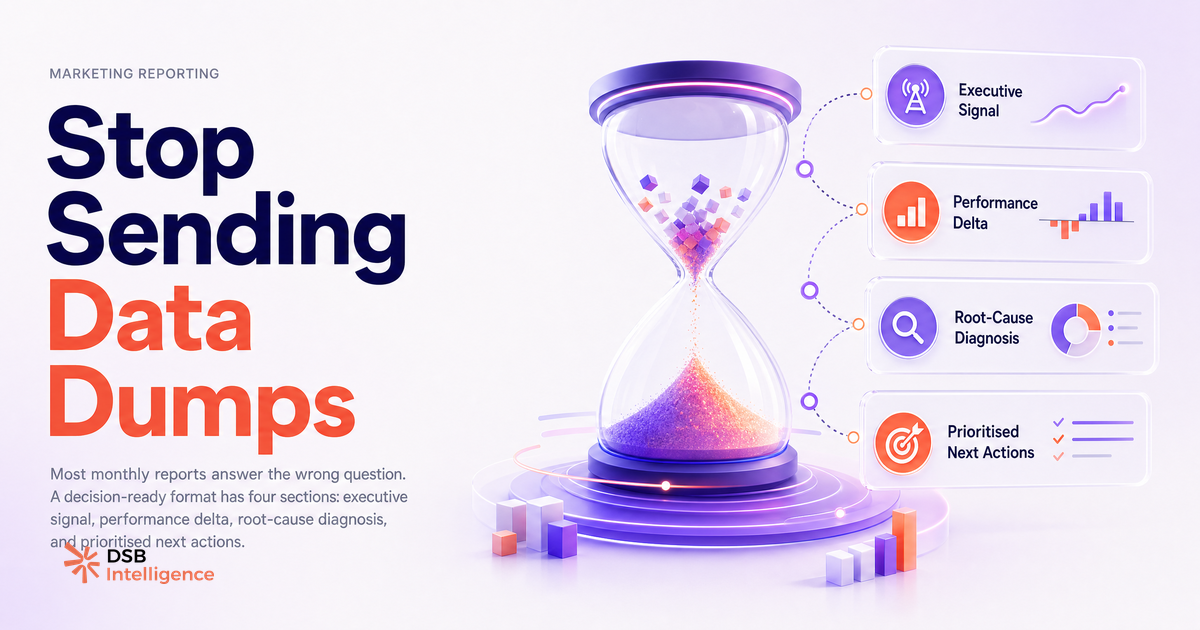
A decision-ready marketing monthly report needs exactly four sections. Not eight. Not a 40-slide deck. Four.
Section 1: Executive signal. One paragraph, written in plain language, that states the headline of the month. Not "impressions were up 12%." Something like: "Paid search drove a 23% increase in demo requests this month, offsetting a flat organic quarter. The growth is concentrated in one campaign — which creates a concentration risk worth watching." That paragraph is the entire report for a time-pressed CEO. Everything else is supporting evidence.
Section 2: Performance delta with context. Show the numbers that moved, with a comparison period and a benchmark. A number without a reference point is noise. "CTR dropped to 1.8%" means nothing. "CTR dropped from 2.4% to 1.8%, against an industry median closer to 2.1% for this category" is a signal. Keep this section to the five or six metrics that actually changed meaningfully. Resist the urge to include everything.
Section 3: Root-cause diagnosis. This is the section most reports skip entirely. What caused the delta? Was it a platform algorithm change, a seasonal pattern, a creative fatigue issue, a budget pacing problem? One paragraph per significant movement. If you don't know the cause, say so explicitly — "we don't have a confirmed explanation yet, here is our working hypothesis" is more credible than silence.
Section 4: Prioritised next actions. Not recommendations. Actions. Numbered, owned, with a timeframe. "We will pause the underperforming ad set by Friday and reallocate budget to the top performer" is an action. "Consider optimising the creative" is not.
This structure works whether you are reporting on LinkedIn organic, paid search, content, or a multi-channel mix. The channel changes; the decision logic does not. For agencies managing LinkedIn-heavy B2B programs, LinkedIn for B2B Marketing: Fix the Scoreboard First covers which platform metrics actually connect to pipeline — a useful filter for section two.
How does the Insight Narrator turn raw metrics into a client-ready narrative?
The bottleneck in agency reporting is never pulling the data. Every platform has an export button. The bottleneck is the interpretation step: taking a spreadsheet of deltas and writing a coherent narrative under time pressure, for a client who will read it in three minutes on a phone.
That is precisely the job DSB Intelligence's Insight Narrator is built for. Feed it the performance data for the period, and it drafts the narrative layer — the executive signal, the causal language around the deltas, the framing that turns a number into a sentence a client can act on. The analyst reviews and edits; the blank-page problem disappears.
The practical gain is not speed for its own sake. It is consistency. The quality of a report's narrative should not depend on whether the account manager had a good Thursday afternoon. Systematising the interpretation layer means every client gets the same standard of diagnosis, regardless of workload.
For agencies that have already tried to automate reporting and hit the usual walls, Automated Reporting for B2B Agencies: Why Most Setups Break documents exactly where the fragility lives — and it is almost never in the data pipeline.
Does a single monthly marketing report format work across channels?
Yes, with one condition: the format must be channel-agnostic at the structural level and channel-specific only at the metric level.
The four-section structure above holds for any channel. What changes is which metrics populate section two. For paid search, that is cost per conversion and quality score movement. For LinkedIn organic, that is reach-to-engagement ratio and post-level dwell time patterns. For content, that is organic entry pages and assisted conversion attribution.
The mistake agencies make is building a separate report template per channel and then stitching them together into a 30-page monthly document. The client does not want 30 pages. They want one verdict, supported by evidence from whichever channels are relevant.
A practical approach: one master report with the four sections, followed by a channel appendix that any stakeholder can skip to if they want the granular numbers. The appendix is for the client's internal team. The four-section body is for the decision-maker.
This also solves the "reporting overhead" problem. If you are spending more than two hours per client per month on report production, the template is broken. The data aggregation should be fully automated. The two hours should go entirely into sections one and three: the executive signal and the root-cause diagnosis. Those are the only parts that require human judgment. For the broader workflow logic behind this, B2B Marketing with LinkedIn: Fix the System First makes the case for systematising the repeatable layer so analysts can focus on interpretation.
When should you break the monthly cadence — and what do you send instead?
The monthly cadence is a default, not a rule. There are three situations where waiting until the end of the month is the wrong call.
First: a material performance cliff mid-month. If a key campaign drops sharply in week two, the client should know in week two, not in four weeks. A short async update — three sentences, one screenshot, one recommended action — is more valuable than the silence that preserves the monthly rhythm.
Second: a budget decision pending. If the client is deciding whether to increase spend before the month closes, they need a directional signal now, not a polished retrospective later. Send a mid-month pulse: executive signal only, no appendix.
Third: a major platform change. When LinkedIn, Google, or Meta rolls out an algorithm or policy change that materially affects the account, proactive communication within 48 hours signals competence. Clients who find out about platform changes from industry newsletters before hearing from their agency draw conclusions about attentiveness.
In all three cases, the format is the same: short, direct, action-oriented. A Loom recording, a Slack message with a screenshot, or a two-paragraph email. The goal is not to replace the monthly report — it is to prevent the monthly report from arriving as a surprise.
The White Label SEO Reporting: What Agencies Actually Need piece covers the related question of how to structure proactive communication for white-label setups, where the agency is invisible to the end client — the same principles apply.
Now what?
- Pull your last three monthly reports and check: does each one have an explicit root-cause diagnosis for every significant delta? If not, that is the first section to rebuild.
- Cut your report to four sections. Move everything else to an appendix. Send the four-section version to one client this month and track whether the follow-up call gets shorter.
- Automate your data aggregation layer completely — if you are still manually copying numbers from platform dashboards into a deck, that time belongs in interpretation, not in data entry.
- Set a trigger for mid-month async updates: any metric that moves more than a defined threshold gets a three-sentence note to the client within 48 hours, no waiting for the monthly cycle.
Ready to stop building reports from scratch every month? Try DSB Intelligence free and see how the Insight Narrator handles the narrative layer so your team can focus on the diagnosis.