

Most asset managers believe their reporting problem is a technology problem. It is not. It is a translation problem, and that distinction changes everything about how you fix it.
What separates the asset managers who report with confidence from the rest?
Confidence in client reporting asset management is rare. Most asset management teams privately rate their own reporting as adequate at best. The firms that break from this pattern do not necessarily have better data or more sophisticated systems. They have a clearer answer to one question: what decision does this report need to support?
That question reframes the entire workflow. A report designed to support a client's quarterly review conversation looks nothing like a report designed to satisfy a compliance checklist. Both can contain identical underlying data. The difference is in the narrative layer: what gets surfaced, what gets explained, and what gets left out.
The confident minority also tracks consumption, not just delivery. Knowing that a report was sent on March 15 tells you nothing. Knowing that the client opened it, spent time on page 4 (the drawdown analysis), and forwarded it to their CFO tells you everything about what they care about. Without that signal, you are optimizing for production, not for client outcomes.
Finally, these firms segment reporting depth by client tier. Not every relationship warrants the same level of narrative customization. A family office with a complex multi-asset mandate needs something fundamentally different from a high-net-worth individual with a standard 60/40 allocation. Treating them identically wastes analyst time and frustrates both clients.
Why does customization break most reporting workflows — and where does the bottleneck actually sit?
Customization breaks at the data-to-narrative translation layer. The underlying portfolio data is almost always available and accurate. The problem is converting it into a client-specific story, under time pressure, across dozens or hundreds of relationships simultaneously.
Most teams solve this with templates. Templates are a reasonable starting point, but they create a ceiling: at some level of client complexity or relationship depth, the template stops fitting and someone has to manually override it. That manual override is where the workflow collapses. One analyst adjusting one section for one client is manageable. Fifteen analysts adjusting fifteen sections for eighty clients, on a quarterly deadline, is a production crisis.
The customization problem compounds as AUM grows. A firm managing 50 client relationships can absorb manual effort. A firm managing 300 cannot, not without either degrading quality or burning out the team responsible for delivery. This is why reporting confidence tends to decline as firms grow: the workflow that worked at one scale simply does not transfer to the next.
The fix is not more templates. It is separating the data assembly layer (which can and should be automated) from the narrative layer (which requires judgment). Once those two layers are decoupled, you can scale the former without sacrificing the latter.
If analysts spend a significant share of their reporting time on data pulls rather than on narrative construction, the bottleneck is in the wrong place. For a broader look at how this structural split applies across client relationships, Client Reporting Systems: What B2B Teams Actually Need covers the underlying framework in detail.
What are the signals that tell you your reporting process is scaling against you?
Three signals appear consistently before a reporting process visibly breaks down.
The first is lengthening revision cycles. When clients push back on reports with "this doesn't reflect what we discussed" or "can you add context on X," it means the report is too generic. One or two revision requests per quarter is normal. A pattern of revisions across multiple relationships is a structural signal.
The second is declining client response rates. If fewer clients are acknowledging receipt, asking follow-up questions, or referencing the report in their next conversation with you, the report is not landing. It is being filed, not read. This is harder to measure than revision cycles, but it is the more important signal: a report that generates no conversation is a missed retention opportunity.
The third is growing time-to-delivery relative to your client base size. If producing reports for 100 clients takes proportionally longer than it did for 50 clients, your process is not scaling. The relationship between client count and production time should flatten as you automate; if it stays linear or worsens, the bottleneck is structural.
Any one of these signals warrants a workflow audit. All three together indicate the process needs to be rebuilt, not patched.
For context on how these same dynamics play out in agency settings, Marketing Agency Client Reporting: What Clients Want maps the overlap and the divergences.
How does surfacing the pattern early prevent it from becoming a client problem?
The challenge with reporting workflow degradation is that it is invisible until it is expensive. By the time a client explicitly complains about reporting quality, the relationship is already at risk. The warning signs described above appear weeks or months earlier, but only if you are looking for them.
This is where the Insight Narrator in DSB Intelligence changes the dynamic: it reads the pattern across your reporting activity and flags the early signals before they surface as client friction. Instead of discovering that a client has gone quiet after three generic reports, you see the drift in engagement before the next quarterly cycle begins.
The practical implication is that you can intervene at the workflow level rather than the relationship level. Adjusting a template or reassigning a narrative segment is a ten-minute fix. Rebuilding trust with a client who feels underserved is a quarter-long project.
How do you move from static PDFs to reporting clients actually read?
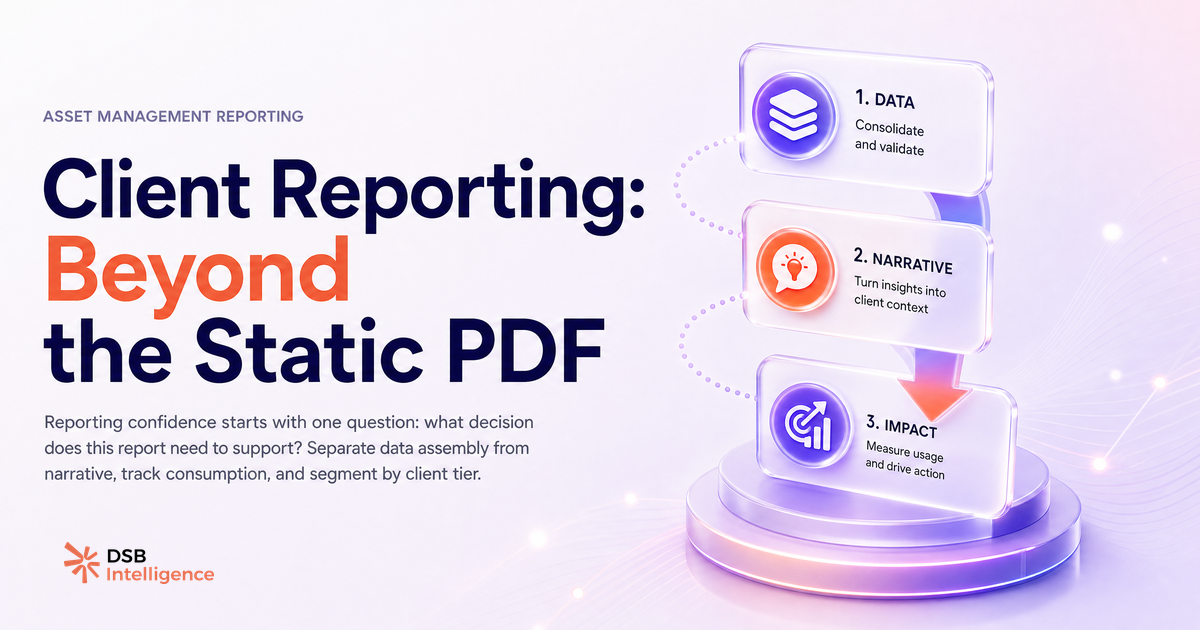
The transition from static to dynamic reporting is not primarily a technology project. It is a workflow redesign with three sequential steps.
First, audit what your current reports are actually answering. Pull the last two quarters of client feedback, revision requests, and follow-up questions. The recurring themes tell you which narrative gaps the static PDF is failing to close. This takes a day, not a sprint.
Second, separate the data assembly layer from the narrative layer in your production process. Data assembly (pulling positions, calculating returns, generating charts) should be automated or semi-automated. Narrative construction (what does this drawdown mean for this client's specific situation?) should be handled by someone who knows the relationship. Most firms have these two activities tangled together, which is why both suffer.
Third, add consumption tracking before you redesign anything else. You cannot improve what you cannot measure. Knowing which sections clients engage with and which they skip is the input that makes every subsequent iteration faster. SEO Client Reporting Is Broken — Fix It Now covers how to instrument this kind of tracking in practice, with examples that transfer directly to asset management contexts.
The firms that have made this transition successfully share one trait: they stopped treating the report as the deliverable. The conversation the report enables is the deliverable. The PDF is just the prompt.
For teams evaluating tooling to support this shift, SEO Agency Reporting Software: What Most Tools Get Wrong is a useful reference on where off-the-shelf solutions tend to fall short and what to look for instead.
Now what?
- Pull your last two quarters of client revision requests. If the same sections keep coming up, that is your narrative gap, not a data problem.
- Map your current production process and identify where data assembly and narrative construction are tangled. That is your first automation target.
- Add at minimum a basic open-tracking layer to your next reporting cycle. Even a simple signal is better than none.
- If you want to catch engagement drift before it becomes a client conversation, try DSB Intelligence free and connect your reporting activity in under ten minutes.