

Most agencies believe their reporting problem is a design problem. Better charts, a cleaner dashboard, a white-labeled portal. It is not. It is a signal selection problem.
Does most SEO agency reporting software optimize for the wrong thing?
Yes. The dominant design philosophy in seo agency reporting software is completeness. Every keyword tracked. Every backlink logged. Every traffic source broken down to the sub-channel level.
Clients do not act on completeness. They act on clarity.
When a client opens a 40-slide monthly report, they are looking for one thing: evidence that the agency's work is moving the needle on something that matters to their business. If they cannot find that evidence in the first two minutes, the report becomes noise. Noise, repeated monthly, trains clients to disengage.
The problem compounds because most agency reporting tools are built to reduce analyst time, not to improve client comprehension. Automation is sold as efficiency. In practice, it often means a perfectly formatted report that answers no question the client was actually asking.
This is not a criticism of automation itself. Automation is necessary at scale. The issue is what gets automated: data delivery, not interpretation.
What are the three metrics that predict client churn before the renewal conversation?
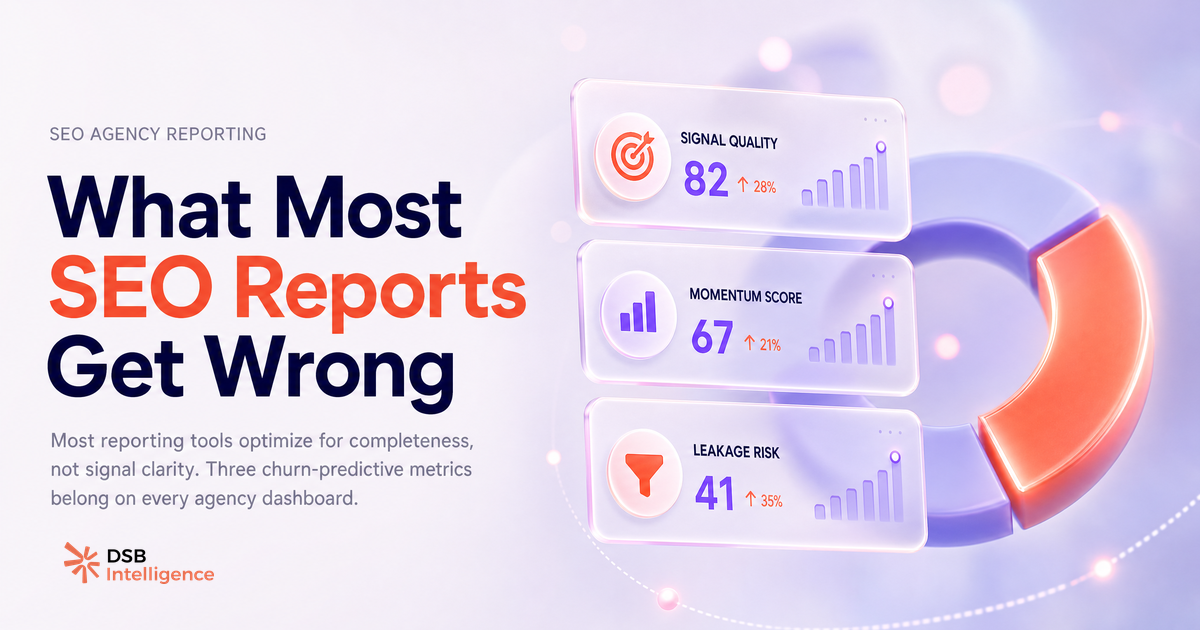
Three signals consistently appear before a client disengages, and most standard agency dashboards do not surface any of them.
Signal one: share of voice on priority keywords. Not overall keyword rankings. Not average position across the full tracked set. Share of voice on the five to ten keywords the client's sales team actually cares about. When that number starts compressing, even slowly, the client's internal stakeholders begin questioning the program. Agencies that catch this early can reframe the narrative. Agencies that miss it walk into a renewal conversation already on the back foot.
Signal two: LinkedIn content engagement on SEO-driven topics. For B2B clients, LinkedIn is not separate from SEO strategy. It is a leading indicator of brand authority. When organic posts tied to the client's target keyword themes stop generating meaningful engagement, it signals that the content angle is losing resonance with the audience. Organic search performance on those same topics tends to follow, typically within one to two quarters. Most seo agency reporting software does not connect these two data streams at all.
Signal three: the traffic-to-pipeline gap. Organic traffic going up while pipeline contribution stays flat is not a win. It is a warning. It means the agency is driving volume on the wrong queries, or that the content is attracting the wrong audience. Clients who notice this gap before the agency does are clients who start looking for alternatives.
Tracking these three signals requires connecting data sources that most reporting tools keep in separate modules. That connection is where the real analytical work happens.
How does DSB Intelligence's Insight Narrator surface these signals without manual data pulls?
The standard workflow at most agencies is: pull data from four platforms, paste into a template, write a summary paragraph, send. That process takes hours per client and still produces reports that miss the signals above.
The Insight Narrator in DSB Intelligence is built for a different job. Instead of asking an analyst to synthesize across disconnected exports, it reads the pattern across LinkedIn analytics, engagement trends, and content performance, then flags the signal before it becomes a problem visible to the client. The output is not a chart. It is a sentence: here is what changed, here is what it likely means, here is what to watch next.
That shift, from data delivery to interpreted signal, is what separates a report clients read from a report clients archive.
For agencies managing ten or more active accounts, the compounding effect is significant. A signal caught two months early on one account is a renewal saved. Across a portfolio, it is a retention rate that compounds.
You can read more about how this connects to broader Client Reporting Systems: What B2B Teams Actually Need in the linked piece.
How do you build a reporting cadence that makes clients feel informed, not overwhelmed?
The answer is not a better template. It is a different frequency logic.
Most agencies default to monthly reports because that is the billing cycle. Monthly is not a cadence built around client decision-making. It is a cadence built around agency convenience.
A cadence built around client decision-making looks like this: a weekly pulse on two or three key signals (one paragraph, no slides), a monthly narrative that connects those signals to a business outcome the client's leadership tracks, and a quarterly review focused entirely on strategic decisions, not data recaps.
The weekly pulse is the most underused format in agency reporting. It is low-effort to produce, high-value to receive, and it keeps the agency visible between monthly reports without adding noise. A client who hears from their agency every week, even briefly, is a client who feels managed.
The quarterly review should contain almost no new data. It should contain decisions: which bets are working, which are not, and what the agency recommends doing differently. Clients who leave agencies rarely cite bad results as the primary reason. They cite feeling uninformed and unheard.
For more on what clients actually want from these touchpoints, see Marketing Agency Client Reporting: What Clients Want.
When does automated reporting create a false sense of account health?
Every time a report is sent and not discussed.
Automated reports get opened, skimmed, and archived. The agency sees the delivery confirmation and assumes the client is satisfied. The client sees a PDF they do not have time to parse and assumes the agency is on top of things. Both assumptions are wrong, and neither party surfaces the disconnect until the renewal conversation.
The false sense of health is most dangerous on stable accounts. An account where nothing is visibly broken is an account where no one is asking hard questions. That is exactly where the three signals above tend to accumulate quietly.
A useful diagnostic: look at your last three monthly reports for each client. Count how many generated a reply, a question, or a meeting request. If the answer is zero, the report is not doing its job. It is providing cover, not communication.
This is a structural problem, not a content problem. The Reporting Automation for Agencies: Why It Stalls piece covers why most automation projects stall at exactly this point: they automate delivery without solving interpretation.
The Client Dashboard: Why Agency-Built Beats Vendor Portals and Client Dashboard Login: What Agencies Get Wrong articles go deeper on the portal side of this problem, specifically why giving clients self-serve access without a guided narrative tends to accelerate disengagement rather than prevent it.
Now what?
- Pull your last monthly report for your three highest-revenue clients. Identify whether share of voice on priority keywords, LinkedIn engagement on target topics, and traffic-to-pipeline contribution are each represented. If any of the three is missing, that is your first gap to close.
- Check your reply rate. For each report sent in the last quarter, count client-initiated responses. A reply rate below one in three is a signal your reports are being archived, not acted on.
- Add a weekly pulse format to one account this month. One paragraph, two signals, one recommended action. Measure whether it changes the quality of the monthly conversation.
- If you want to see how automated signal detection changes the workflow across a full client portfolio, start a free trial of DSB Intelligence and connect your first account in under ten minutes.