

Automating reports is easy. Automating the thinking behind them is the part nobody has solved yet.
That gap is why agencies invest in reporting automation tools, cut the delivery time in half, and still find their senior strategists rewriting the analysis section at 10pm before a client call.
Why do most agencies automate the output instead of the thinking?
The output layer is where automation tooling is mature. Scheduled data pulls, templated dashboards, PDF exports, white-labeled client portals: all of this works reliably and is relatively cheap to set up. So agencies start there, which is rational.
The problem is that clients don't pay for a PDF. They pay for an answer to the question: "Is what we're doing working, and what should we change?" That answer requires interpretation, not just formatting.
Interpretation means comparing this week's numbers against a relevant baseline, flagging the one metric that moved for a structural reason (not just noise), and connecting the data back to the objective the client actually cares about. None of the mainstream reporting automation tools do this by default. They surface numbers. The strategist still writes the story.
The result is a two-speed workflow: the data delivery is automated and fast, the analysis is manual and slow. The bottleneck didn't disappear. It moved upstream, out of sight, and became harder to measure.
This is the core finding in Automated Reporting for B2B Agencies: Why Most Setups Break: agencies that automate without addressing the interpretation layer end up with more reports, not better ones.
How do you build a reporting process that holds up under client scrutiny?
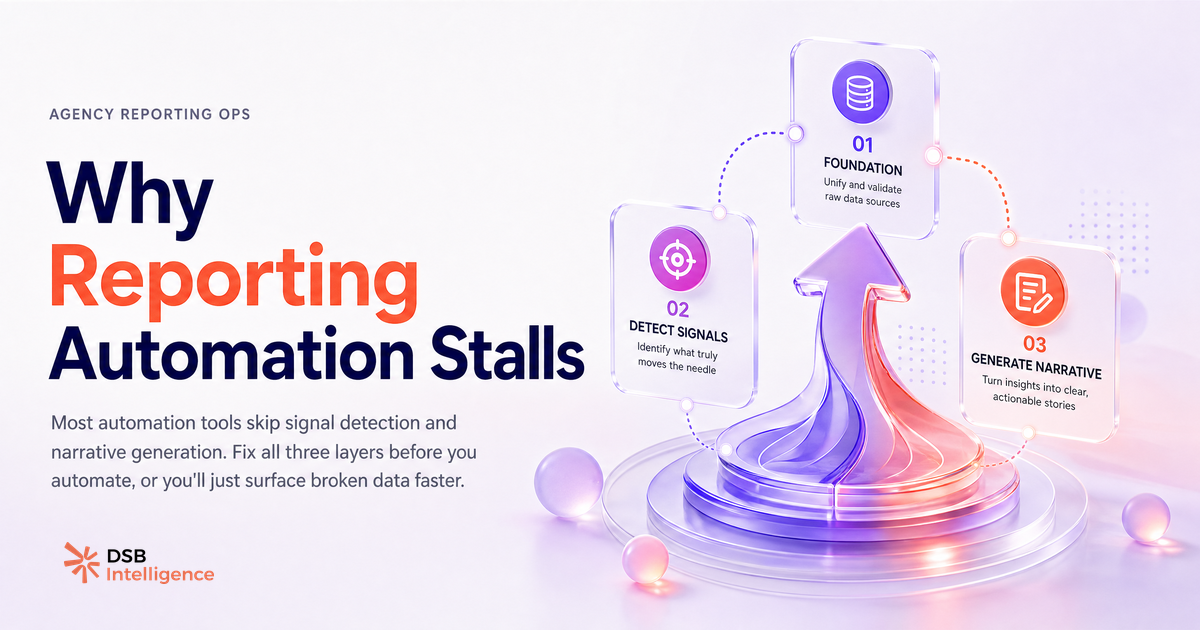
A reporting workflow that survives a skeptical client call has three distinct layers, and each one needs to be addressed before the next one can be automated.
Layer 1: Data pull and normalization. Every source (LinkedIn, CRM, paid channels, web analytics) needs to output data in a consistent schema. Inconsistent naming conventions, different date granularities, and mismatched attribution windows are what cause manual reconciliation work. Fix this layer first. It's unglamorous, but it's the foundation.
Layer 2: Signal detection. This is the step that separates a meaningful change from normal variance. A 12% drop in LinkedIn post reach is either a content quality issue, an algorithm shift, or a normal weekly fluctuation. The signal layer applies context (historical baseline, channel benchmarks, client objective) to decide which one it is. Most automation reporting tools skip this entirely because the context lives in the strategist's head, not in the tool.
Layer 3: Narrative generation. Once signals are identified, the report needs to explain them in plain language tied to the client's goals. This is the paragraph that takes two hours to write manually. Automating it requires a structured interpretation model, not just a template.
Agencies that build all three layers in sequence report a genuine reduction in reporting time. Agencies that jump straight to layer 3 (narrative templates) without fixing layers 1 and 2 end up with automated reports that are confidently wrong.
For a broader view of how this applies to SEO deliverables, SEO Client Reporting Is Broken — Fix It Now covers the same structural failure mode in a different channel context.
What signal layer are most reporting tools skipping, and why does it matter for B2B analytics?
The signal layer is the step that requires the most context to execute well, which is exactly why it gets skipped. Building it means storing client objectives, historical performance baselines, and channel-specific benchmarks inside the reporting system, not just in a spreadsheet or a strategist's memory.
For B2B LinkedIn analytics specifically, the signals that matter most to clients are rarely the ones that are easiest to pull. Total impressions and follower count are easy. Reach composition shifts (are you reaching decision-makers or interns?), content decay curves (how fast does a post lose distribution after the first 48 hours?), and audience overlap across organic and paid are harder. They require a data model that goes beyond the standard LinkedIn analytics export.
When the signal layer is missing, clients receive a report full of numbers and no clear answer to "what changed and why." That forces the account manager to reconstruct the analysis verbally on the call, which erodes confidence in the reporting process itself.
This is also where Social Media Manager Tools: The Agency Stack That Works draws the clearest line: the tools that earn long-term adoption in agency stacks are the ones that surface signals, not just data.
How does an interpretation layer fit into an automated reporting stack?
The interpretation layer is the piece that connects raw metrics to client-facing narrative. In practice, it needs to sit between the data pull and the report template, not after the template is already populated.
DSB Intelligence's Insight Narrator is built for exactly this position in the stack. It reads the metric pattern, applies the context of the client's stated objectives and historical baseline, and generates a structured interpretation: what moved, why it likely moved, and what the implication is for the next period. The output feeds directly into the report narrative rather than replacing the strategist's judgment.
The key distinction is that Insight Narrator flags patterns the strategist should validate, not conclusions they should accept blindly. It reduces the time spent staring at a dashboard trying to decide if a number is interesting. That decision still belongs to the human. The tool just makes it faster to reach.
For agencies running LinkedIn-heavy client portfolios, this is the layer that makes automated report generation viable at scale, because the LinkedIn signal space is wide enough that manual interpretation doesn't scale past a handful of accounts.
When does reporting automation create more work, not less?
Automation amplifies whatever is already in the system. If the data model is inconsistent, automated reports surface inconsistent data faster and more visibly. If the interpretation layer is missing, automated delivery just means clients receive confusing reports on a tighter schedule.
The most common failure mode is adding a new automation reporting tool on top of an existing broken workflow. The tool works as advertised. The workflow is still broken. Now there's also a new tool to maintain.
Three situations where reporting automation reliably creates more work:
-
Multiple data sources with no shared schema. Every report cycle requires manual reconciliation before the automated output can be trusted. The automation saves formatting time but adds a QA step that didn't exist before.
-
No documented interpretation logic. When the "what does this metric mean for this client" logic lives only in a senior strategist's head, automation can't encode it. Junior team members using the automated report as a source of truth will draw wrong conclusions.
-
Clients with shifting objectives. Automated reports are built against a fixed objective model. When client priorities shift mid-quarter, the report keeps optimizing for the old objective until someone manually updates the template. That lag creates credibility problems.
The fix in all three cases is the same: slow down the automation rollout, fix the underlying model, then re-automate. It's slower in the short term. It's the only approach that works past the first quarter.
For a concrete look at how LinkedIn-specific automation tools fit (or don't fit) into this picture, Expandi LinkedIn Automation Tool: Honest Review and LinkedIn Rockwell Automation: What Industrial B2B Can Learn both illustrate how automation without a clear signal model creates noise instead of insight.
Now what?
- Audit your current reporting stack against the three layers: data pull, signal detection, narrative generation. Identify which layer is the actual bottleneck before adding any new tool.
- Document the interpretation logic for your top three clients. Write down what a "meaningful change" looks like for each one. This is the input any interpretation layer needs to function.
- Fix data model inconsistencies in your pull layer before your next reporting cycle. One shared schema across sources is worth more than any reporting automation tool you can buy.
- Test an interpretation layer on one client account before rolling it out. Measure time-to-delivery and client question rate on the call. Those two numbers tell you whether the automation is working.
Ready to stop rewriting the analysis section at 10pm? Start a free trial of DSB Intelligence and see what Insight Narrator surfaces on your first client account.