

Most teams look at a page like Rockwell Automation's and walk away with the same non-insight: "they post a lot and they have a big audience." That observation is useless. The useful question is what the content mix actually consists of — and whether the pattern is reproducible.
What does Rockwell Automation's LinkedIn content mix actually look like?
The page does not win on volume. It wins on specificity.
A scroll through Rockwell Automation's LinkedIn feed reveals a consistent structural pattern: posts are anchored in named deployments, measurable outcomes, or identifiable industry contexts. A post about a food and beverage automation project names the challenge, the technology applied, and the operational result. A workforce post ties a hiring milestone to a specific facility or initiative. A partner announcement names the integration and the use case, not just the logo.
This is the opposite of what most industrial B2B teams produce. The default is a post that could have been written by any company in the sector: "We're proud to support our customers' digital transformation journeys." Rockwell's content is identifiable as Rockwell's because it is specific enough to be useless to a competitor.
Format diversity reinforces this. The page uses native documents (the LinkedIn equivalent of a slide deck), short video clips from plant floors and trade events, and image posts — rarely link-out posts that push the audience off-platform. That format discipline is not accidental. LinkedIn's feed deprioritizes external links; pages with large followings have learned this the hard way and adjusted.
For teams building or auditing their own setup, LinkedIn Company Page Setup: What Most Teams Get Wrong covers the structural decisions that determine whether a page compounds or flatlines from day one.
What signals actually drive reach for a 500k+ follower page — and why smaller pages can replicate the pattern?
Follower count is a lagging indicator. It reflects years of compounding, not a current strategy you can copy this quarter.
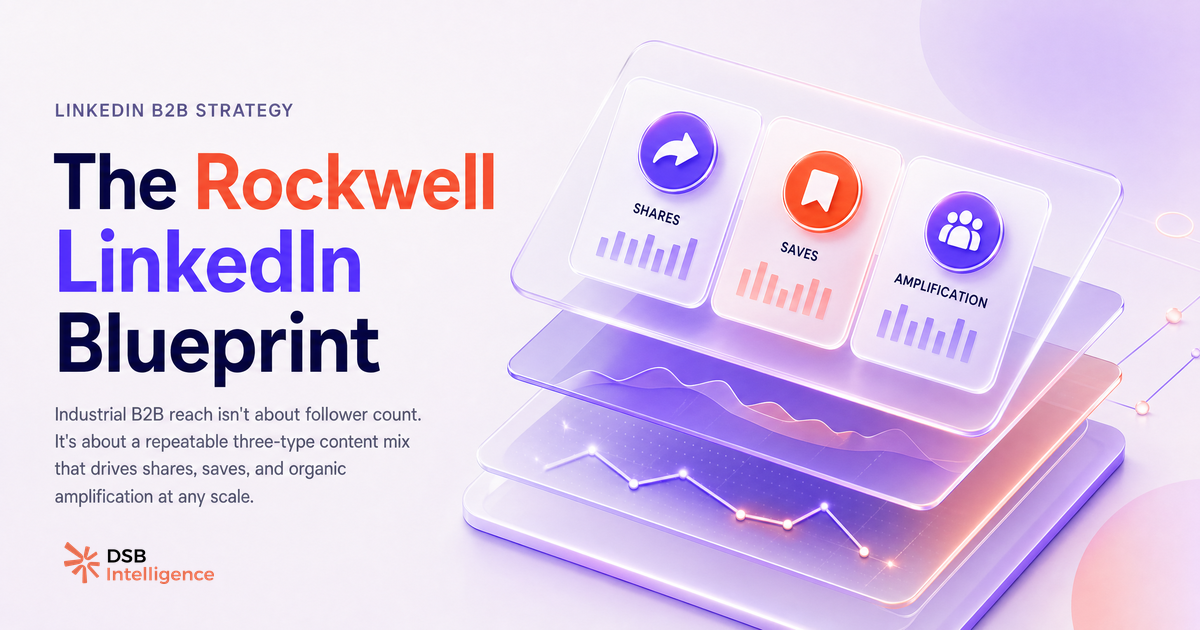
What you can copy is the content type ratio. On pages that sustain high organic reach in industrial B2B, three content types carry disproportionate weight: customer application stories (real deployments, named contexts), workforce and culture posts (hiring, employee milestones, team spotlights), and ecosystem partner announcements (integrations, certifications, co-developed solutions). These three types generate shares and saves, not just likes. Shares and saves are the engagement signals that most resemble dwell time proxies — they indicate that someone found the content worth returning to or redistributing.
A smaller page with 8,000 followers can run the same ratio. The absolute numbers will differ; the structural logic does not. A mid-market manufacturer that posts one specific customer story per month, one workforce post per month, and one partner announcement per month is running the same playbook at a different scale.
The compounding effect kicks in when employee amplification is layered on top. Rockwell's reach is not purely organic from the company page — it is amplified by employees who share specific post types. The pattern is consistent: technical and application-focused posts get shared by engineers; workforce posts get shared by recruiters and team leads. Activating employees on the right post types, rather than asking everyone to share everything, is what separates systematic amplification from noise.
How to Set Up a LinkedIn Company Page That Doesn't Flatline goes deeper on the structural decisions that determine whether employee amplification actually compounds.
How do you read company page signals to benchmark your own content against category leaders?
Benchmarking a page like Rockwell's without a structured framework produces surface-level observations. "They post videos" is not a benchmark. "Their video posts generate three times the share rate of their image posts, and the videos are all under 90 seconds and shot on-site" is a benchmark.
The framework has three layers. First, format distribution: what percentage of posts in the last 90 days are video, native document, image, and text-only? Second, engagement type distribution: what share of total engagement comes from likes versus comments versus shares? A page where shares represent a meaningful fraction of total engagement is generating content people want to redistribute — that is a different signal than a page that collects likes. Third, topic clustering: which content topics appear in the top-performing posts? Is it product-led, customer-led, or culture-led?
This is where DSB Intelligence's Insight Narrator is useful: it reads the pattern across these three layers and surfaces what is actually driving reach on a given page, rather than leaving you to eyeball a feed and guess. The goal is a reproducible benchmark you can run quarterly, not a one-time audit that goes stale.
For teams that produce video content as part of this mix, LinkedIn Video Editor Jobs: What B2B Hiring Reveals shows what the demand signal in hiring data says about where B2B video strategy is heading.
What are the three moves mid-market B2B brands consistently skip when studying a page like Rockwell's?
The first skipped move is benchmarking by content type, not by follower count. Teams look at Rockwell's follower number and conclude they are too far behind to learn anything useful. The relevant comparison is not "how many followers do they have" but "what content type generates the most shares on their page, and are we producing that type at all."
The second skipped move is tracking dwell-time proxies. Most teams optimize for likes because likes are visible. Saves and shares are harder to track at scale on a competitor's page, but they are the signals that indicate content worth replicating. A post with 200 likes and 40 shares is structurally different from a post with 200 likes and 3 shares — the first one is being redistributed into networks the page does not already reach.
The third skipped move is selective employee activation. The default approach is to ask the whole team to share every post. The effective approach is to identify which post types generate organic employee shares already, then build a lightweight process around those specific types. Rockwell's amplification works because the right people share the right posts — not because everyone shares everything.
Page administration and access control matter here too. If activating employees on content requires navigating a broken permissions setup, the amplification never happens. How to Add an Admin to a LinkedIn Page (The Right Way) covers the access layer that teams consistently overlook until it blocks execution.
One more resource worth reading alongside this: Taplio LinkedIn Video Downloader: What B2B Teams Miss examines what the tooling choices around LinkedIn video reveal about how B2B teams are (and aren't) building systematic content workflows.
Now what?
- Pull the last 90 days of posts from one category leader in your sector (Rockwell Automation if you're in industrial automation, or the equivalent in your vertical). Sort by shares, not likes. Note the top three content types.
- Map your own page's last 90 days against the same three layers: format distribution, engagement type split, topic clustering. The gap between the two maps is your actual benchmark.
- Identify the one post type on your page that already generates the highest share rate. Build a repeatable production process around that type before adding new formats.
- Run this benchmark quarterly, not once. A single audit tells you where you are; a quarterly cadence tells you whether you're closing the gap.
Ready to benchmark your LinkedIn company page against category leaders without the manual spreadsheet work? Start your free trial with DSB Intelligence and run your first competitive content audit in under 10 minutes.