

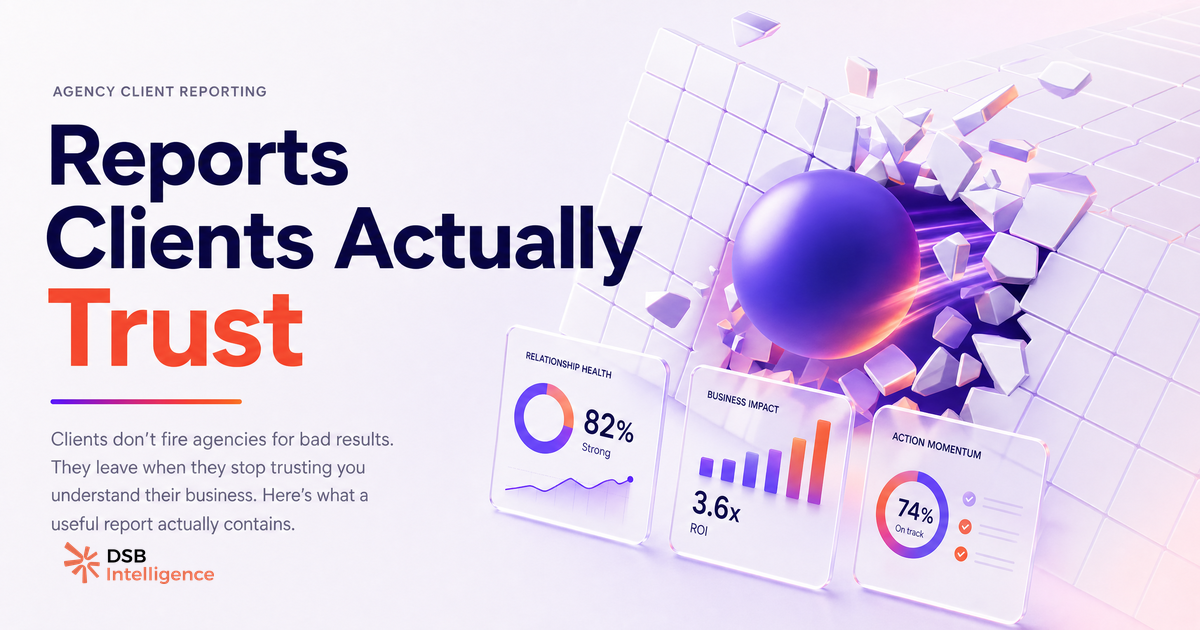
Clients don't fire agencies because the numbers were bad. They fire agencies because they stopped believing the agency understood their business.
That distinction is everything in marketing agency client reporting.
Why do most agency reports answer the wrong question?
Most reports answer "what happened last month." The client's actual question is "is this working, and should I keep paying for it?"
Those are not the same question. One is a data summary. The other is a business judgment. Agencies that conflate the two produce reports that are technically accurate and strategically useless.
The pattern is consistent: a cover slide with the agency logo, a page of impressions and follower growth, a bar chart of post performance, a screenshot of the top three posts, and a closing slide with "next month's focus." The client reads none of it carefully. They skim for a number that feels meaningful, find none, and start wondering whether they're getting value.
The problem isn't the data. It's the absence of interpretation. Data without context is just noise with good formatting.
A useful report starts with the client's business question — "are we reaching the right decision-makers?" or "is our content moving prospects further down the funnel?" — and works backward to the metrics that answer it. Everything else is optional.
See how this connects to dashboard design in Client Dashboard: Why Agency-Built Beats Vendor Portals: the same logic applies. The tool should serve the client's question, not the agency's convenience.
What does a useful client report actually contain (and what should you cut)?
A useful report contains three things: the signal that moved, the reason it moved, and the next action.
That's it. Everything else is supporting evidence or noise.
The signal that moved means one or two metrics that changed meaningfully since the last report. Not all metrics. Not a dashboard screenshot. The specific number that tells the story of the period.
The reason it moved is where agencies earn their fee. Anyone can pull a number from LinkedIn analytics. Explaining why engagement dropped on week three, or why a specific post format outperformed the rest of the content calendar — that's judgment. That's what clients are paying for.
The next action closes the loop. Without it, the report is a historical document. With it, it's a working document. "We're shifting to carousel formats for the next four weeks to test whether the format or the topic drove the spike" is a sentence that justifies the retainer.
What to cut: follower count (a lagging indicator that clients over-index on and agencies can't control directly), raw impression volume without reach-to-target-audience context, post frequency counts, and any metric that requires a footnote to explain why it matters.
If you're unsure what to track in the first place, LinkedIn Report Template: What to Actually Track covers the metric selection decision in detail.
How does surfacing the right signal change the client conversation?
The bottleneck in most agency reporting workflows isn't data access. It's interpretation time.
Analysts spend the majority of report-production time pulling, cleaning, and formatting data. The actual thinking — "what does this pattern mean, and what should the client do about it?" — gets compressed into the last hour before the report goes out. That's when the narrative gets thin.
This is where DSB Intelligence's Insight Narrator changes the workflow. It reads the performance data and surfaces the signal worth talking about: which content drove meaningful reach into the target audience, where engagement dropped and why the pattern suggests a format issue rather than a topic issue. The analyst stops being a data janitor and starts being an advisor.
The output isn't a pre-written report. It's a prioritized reading of what happened, so the human can spend their time on the judgment layer — not the extraction layer.
That shift is what separates agencies that retain accounts from agencies that lose them at the six-month mark. Clients don't notice the automation. They notice that the analyst always seems to know exactly what to say.
For more on where automated setups typically break down, Automated Reporting for B2B Agencies: Why Most Setups Break is worth reading before you rebuild your stack.
What reporting cadence reduces client churn without adding overhead?
The right cadence matches the client's anxiety level, not the agency's workload.
A monthly strategic report is the baseline. It covers performance against goals, the key signals from the period, and the strategic direction for the next month. It's the document that justifies the retainer and sets expectations.
But monthly reports leave a three-week silence between touchpoints. In that silence, clients fill the gap with their own narrative. If a post underperformed in week two, and the next report isn't until week four, the client has two weeks to decide the agency doesn't know what it's doing.
A lightweight weekly signal breaks that pattern. One paragraph. Two or three numbers. One sentence on what it means. Sent on the same day every week, without fail.
This isn't a second report. It's a pulse check. It says "we're watching, we noticed, here's what we're thinking." That consistency is worth more than a polished monthly deck, because it removes the silence that breeds doubt.
The overhead concern is real but solvable. If the weekly signal takes more than fifteen minutes to produce, the data pipeline is broken. Fix the pipeline, not the cadence.
Client Reporting Systems: What B2B Teams Actually Need covers the infrastructure side of this — specifically how to build a signal-detection layer that makes the weekly pulse sustainable.
When does a polished report still lose the account?
A report can be well-designed, on time, and full of accurate data — and still cost the agency the account.
Three scenarios where this happens:
The report arrives late. Not catastrophically late — just a few days after the agreed date. The client notices. They don't say anything. But the mental model shifts from "reliable partner" to "vendor I have to chase." That shift is hard to reverse.
The report skips context. Numbers without benchmarks are meaningless. "Engagement rate of 2.3%" means nothing unless the client knows whether that's above or below their industry baseline, above or below their own previous period, and above or below what the agency promised. Context is what turns a number into a judgment.
The report doesn't connect to pipeline. This is the most common failure mode for LinkedIn analytics specifically. Reach and engagement are intermediate metrics. The client's actual question is whether any of this is moving prospects toward a conversation. If the report can't draw that line — even qualitatively — the client draws their own conclusion, and it's usually "this isn't working."
The fix for all three is the same: treat the report as the agency's argument for its own value. Every section should answer the implicit question "why does this matter to my business?" If a section can't answer that, cut it.
Client Dashboard Login: What Agencies Get Wrong covers a related failure mode: giving clients direct dashboard access without the interpretation layer, which produces the same outcome as a report without context.
Now what?
- Audit your last three client reports. For each one, identify whether it answered "what happened" or "what this means for your business." If it's consistently the former, the narrative layer is missing.
- Cut every metric from your standard template that the client can't act on. If it requires a footnote to explain why it matters, it doesn't belong in the executive summary.
- Add a weekly pulse check to every active account. One paragraph, three numbers, one sentence of interpretation. Set a recurring calendar block and protect it.
- If your data pipeline is the bottleneck — if pulling and formatting takes longer than interpreting — fix the pipeline first. The narrative won't improve until the extraction is fast.
Ready to stop producing reports and start producing arguments? Try DSB Intelligence free and see how the Insight Narrator changes what your analysts spend their time on.