

If you searched "grow therapy client dashboard" expecting a marketing analytics tool, you have hit the wrong SERP. Let's fix that quickly, then get to what you actually need.
Why does "grow therapy client dashboard" return a mental health portal, not a marketing tool?
Grow Therapy is a US-based telehealth platform that connects patients with licensed therapists. Its client dashboard is a patient portal: session scheduling, billing, insurance claims. Useful if you are a therapist or a patient. Completely irrelevant if you run a B2B agency or manage LinkedIn content for clients.
The keyword collision happens because "grow," "therapy," and "client dashboard" each carry separate search intents that the algorithm conflates. "Grow" reads as a brand name. "Therapy" anchors the health vertical. "Client dashboard" is generic enough to match anything.
The result: a SERP that is 90% mental health product pages, with zero overlap with what marketing and social media agencies need. This is a textbook keyword mismatch, and it is worth naming clearly before moving on.
For a broader look at how dashboards mislead by design, the piece on Freedom Debt Relief Client Dashboard: What It Shows and Hides runs the same diagnostic on a financial services context.
What do agencies actually search for when they type "client dashboard"?
The underlying intent is almost always the same: a reporting interface an agency can hand to a client without a 30-minute explanation.
For LinkedIn-focused agencies, that means a view of organic reach, engagement quality, audience growth, and content-driven profile visits. Not a raw data export. Not a screenshot from LinkedIn Analytics. A structured, readable summary that answers the client's real question: "Is this working, and should I keep paying for it?"
The challenge is that most agencies conflate their internal analytics workflow with their client reporting workflow. These are different jobs. Internally, you need granularity: post-level data, time-series breakdowns, anomaly flags. The client needs three to five numbers, a plain-language interpretation, and a recommendation for the next period.
Mixing the two is where most client relationships start to erode. The client gets a spreadsheet they cannot read, starts to feel like they are paying for complexity rather than results, and the renewal conversation gets harder.
SEO Client Reporting Is Broken — Fix It Now covers this pattern in the SEO context, but the structural failure is identical for LinkedIn reporting.
What are the three things a real client analytics dashboard must do (and most don't)?
A client analytics dashboard that actually supports retention does three things. Most tools handle one, sometimes two.
First: it pulls data automatically. Manual reporting is a tax on the agency's time and a source of inconsistency. If the numbers change depending on when someone ran the export, the client loses trust in the data before they lose trust in the strategy. Automation is table stakes, not a differentiator.
Second: it surfaces signal, not noise. Impressions and total likes are noise. The signals that predict whether LinkedIn content is building pipeline are: reach among the target audience segment, engagement rate from decision-maker profiles, and the ratio of profile visits to post views. A dashboard that reports the first set without the second is a vanity metrics machine.
Third: it delivers a narrative layer. This is where almost every tool stops short. Raw numbers, even the right ones, do not tell a client what to do next. A dashboard that ends with a table leaves the interpretation work to the client, which means they will interpret it wrong, or not at all. The narrative layer is a two to three sentence plain-language summary: what happened, why it matters, what changes next period.
This is the job that DSB Intelligence's Insight Narrator is built for: it reads the pattern in the metrics and produces the plain-language interpretation automatically, so the agency is not writing that paragraph from scratch every month.
For context on what clients in a LinkedIn ghostwriting or content retainer are actually evaluating when they look at these dashboards, LinkedIn Ghostwriter: What Clients Pay For in 2026 is worth reading alongside this.
How should a B2B agency structure client-facing LinkedIn reporting?
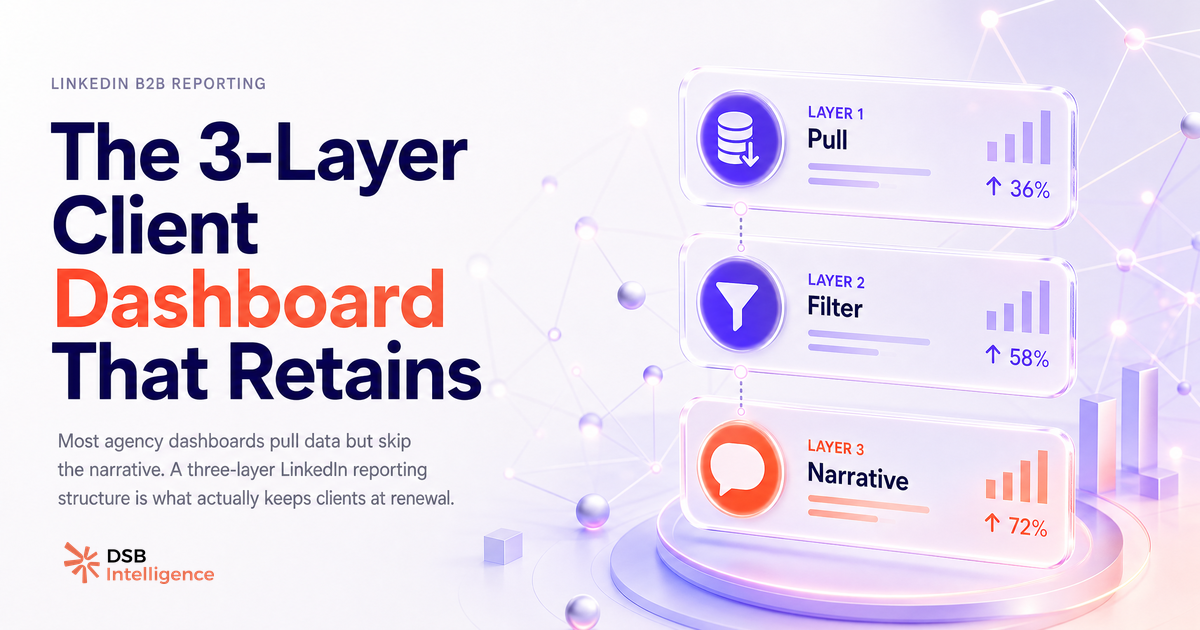
Structure matters as much as the data itself. A client-facing LinkedIn reporting setup that holds up across a 12-month retainer has a clear separation of layers.
The first layer is the data pull: automated, consistent, covering reach, engagement, audience demographics, and profile visits. This runs without human intervention.
The second layer is the filter: the agency's internal view, where you see everything and flag anomalies. This is where you decide what is worth surfacing to the client and what is operational noise.
The third layer is the client view: a curated summary of four to five metrics, a narrative paragraph, and a forward-looking action item. This is what gets shared. Nothing else.
Agencies that maintain this separation retain clients longer. The client never feels overwhelmed. They see progress, understand the interpretation, and have a clear sense of what the agency is doing next. That is the renewal conversation you want.
What a Personal Branding Agency Actually Does for B2B goes deeper on how to frame these outputs in a personal branding context, where the client's own profile is the asset being managed.
For teams dealing with the automation layer specifically, Automated Reporting for B2B Agencies: Why Most Setups Break covers the failure modes in detail.
Now what?
- Audit your current client-facing dashboard: count how many metrics you report, then ask which ones a client can connect to a business outcome. Cut everything that fails that test.
- Build a separate internal view and client view. If you are using the same export for both, you are doing the client's interpretation work for them, and they are not doing it.
- Add a narrative layer to every report. Two to three sentences: what happened, why it matters, what changes next. Write it before you share the numbers.
- If you want to see how automated LinkedIn reporting with a built-in narrative layer works in practice, start a free trial of DSB Intelligence and run your first client report in under 10 minutes.