

More posts, more reach. That's the assumption baked into most LinkedIn content advice. The data pattern tells a different story.
Are the accounts posting daily actually the ones losing reach?
For a significant share of B2B accounts, yes. The pattern is consistent enough to be worth naming: accounts that ramp up to daily posting often see their per-post impressions fall, not rise.
The mechanism is straightforward. LinkedIn's feed doesn't distribute all your content equally. Each post enters a distribution window — typically 24 to 48 hours — during which the algorithm collects engagement signals (reactions, comments, shares, dwell time) before deciding how widely to amplify it. When you publish a new post before the previous one has finished its cycle, you effectively compete with yourself for your own audience's attention.
The result is a dilution effect. Your followers see your new post, scroll past the older one, and neither accumulates the signal density that triggers broader distribution. Reach per post drops. Total reach may stay flat or even decline despite higher volume.
This isn't unique to LinkedIn. The same compression effect shows up across algorithmic feeds. But on LinkedIn, where organic reach is already narrower than on platforms with larger consumer audiences, the cost of self-competition is higher.
Understanding LinkedIn Click-Through Rate Is the Wrong Metric helps here: the problem isn't just what you measure, it's when you measure it. Per-post impressions tracked over the full 48-hour window tell you far more about cadence health than a daily CTR snapshot.
What does the engagement curve actually look like across posting frequencies?
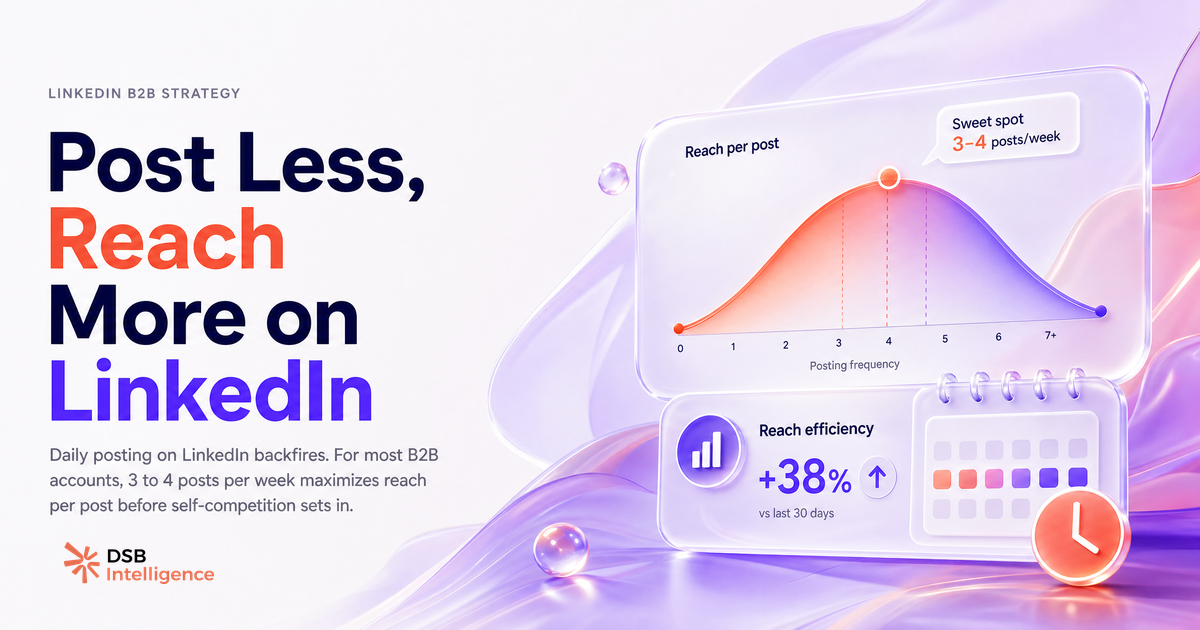
The engagement curve is not linear. It's closer to an inverted U.
At very low frequency (one post per week or less), reach per post tends to be high but total visibility is capped by sheer volume. The algorithm has time to distribute each post, but there's simply not enough content to build momentum or stay present in your audience's feed.
As frequency increases toward 3 to 4 posts per week, most B2B accounts hit a productive range. Each post gets a full distribution window. Engagement accumulates. The algorithm registers the account as consistently active without penalizing it for flooding the feed.
Beyond 5 posts per week, the curve flattens for most accounts, then bends downward. The exceptions exist — large pages with highly engaged audiences, media-style accounts with editorial teams — but they are the exception, not the template.
What drives the curve down at high frequency isn't LinkedIn punishing you for effort. It's audience fatigue combined with self-competition. Your followers have a finite attention budget. When you consume more of it than your content quality justifies, engagement rates drop. Lower engagement rates signal to the algorithm that your content is less relevant. Distribution narrows.
The implication for LinkedIn thought leadership content is direct: the organic foundation has to hold before you amplify with paid. If your organic cadence is already diluting reach, paid amplification won't fix it.
How does the Recommendations Engine flag cadence drift before it kills your reach?
Cadence drift is the slow, often unnoticed shift toward posting more without measuring whether more is working. It's one of the most common patterns in B2B LinkedIn accounts that have been active for 12 months or longer.
It usually starts with a reasonable decision: a campaign launches, a product ships, an event approaches, and the team decides to increase posting frequency. The campaign ends. The frequency doesn't come back down. Three months later, the account is posting daily out of habit, not strategy.
The reach signal arrives late. By the time impressions per post have visibly declined, the drift has been running for weeks. Most teams only notice when someone pulls a monthly report and asks why organic visibility is down.
DSB Intelligence's Recommendations Engine is built to catch this earlier. It tracks the relationship between posting cadence and per-post reach over rolling windows, and flags when the curve starts bending in the wrong direction — before the decline becomes a trend. The flag isn't "you're posting too much." It's "your reach-per-post is declining as your cadence increases: here's the window where the divergence started."
That early signal is what lets you adjust cadence before the algorithm has fully downgraded your distribution.
What posting rhythm actually holds for B2B accounts?
The framework is simpler than most content calendars suggest.
Start with your engagement baseline. Look at your last 30 days of posts. What is your median impressions-per-post? What is your median engagement rate? If both numbers are healthy and stable, your current cadence is working. Don't change it.
If impressions per post are declining while your posting volume is flat or rising, reduce frequency by one post per week and hold for three weeks. Measure again. The goal is to find the cadence where each post gets a full distribution window and your audience engagement rate stabilizes.
For most B2B accounts with audiences under 10,000 followers, 3 posts per week is a defensible starting point. For accounts with larger, highly engaged audiences, 4 to 5 posts per week can work — but only if the engagement baseline supports it.
Consistency matters more than optimization at the margin. A cadence you can sustain with high content quality for 90 days beats a theoretically optimal cadence you can only hold for three weeks before quality drops.
On the format side, how you use hashtags and how you structure each post for dwell time matter more at lower frequency — because each post carries more weight. Get the fundamentals right before you add volume.
For industrial B2B accounts specifically, the Rockwell Automation LinkedIn case is instructive: consistent, lower-frequency content built around specific expertise outperformed high-volume generic posting in terms of sustained organic visibility.
When is posting more actually the right call?
More frequency is justified in exactly one scenario: your current posts are consistently generating strong engagement before you add more.
Strong engagement means your median post is hitting above your historical baseline on impressions and reactions before you publish the next one. It means your audience is actively responding, not passively scrolling. It means the algorithm is already amplifying your content beyond your direct network.
If those conditions are true, adding one more post per week is a reasonable test. Add it, hold for three weeks, measure the per-post impact. If impressions per post hold steady or rise, the cadence expansion is working. If they drop, you've found your ceiling.
The mistake most accounts make is treating frequency as a lever to pull when reach is declining. It's the opposite of what the signal calls for. Declining reach is a signal to reduce frequency and improve quality per post, not to post more and hope the volume compensates.
LinkedIn Sales Navigator users running outbound alongside organic content face a compounded version of this: if your content cadence is already diluting your organic reach, your outbound touchpoints land in a weaker brand context. The two motions reinforce each other when the cadence is right — and undermine each other when it isn't.
Now what?
- Pull your last 30 days of post data. Calculate median impressions per post and median engagement rate. Set this as your baseline.
- If you're posting more than 4 times per week, reduce by one post per week and hold for three weeks before measuring again.
- Before adding any post to your calendar, ask: did my last post finish its 48-hour distribution window with strong engagement? If not, hold.
- Track cadence alongside reach, not separately. The relationship between the two is the signal.
Start your free trial of DSB Intelligence to track your cadence-to-reach ratio automatically and get early warnings before drift becomes a trend.