

The best LinkedIn video ads examples are not in any gallery. They are in your own Campaign Manager, buried under metrics most teams never open.
What do top-performing LinkedIn video ads actually look like (beyond the gallery curations)?
The ads that generate pipeline share a structure that looks almost boring next to award-winning creative. No cinematic opening. No brand logo in the first frame. The first three seconds show a problem the viewer already has.
That constraint is not aesthetic preference. It reflects how the LinkedIn feed works: autoplay, muted, mid-scroll. Your viewer has not opted in. They are moving fast. A logo reveal or a music swell is invisible to them.
The structural pattern of high-converting B2B video ads runs like this: problem in frame one, named audience in frame two ("If you run a 10-person sales team..."), single claim in the middle, one action at the end. That is it. No secondary offer, no "follow us for more," no multi-step CTA.
This pattern holds across verticals because B2B LinkedIn audiences are narrow. When you target a 50,000-person segment of VP-level buyers, every wasted second of creative is a wasted impression on a person you may only reach a handful of times before frequency kills your CPM.
For a deeper look at how format choices interact with organic distribution, see Video Format for LinkedIn in 2026: What Actually Matters.
What structural patterns drive watch time and conversion in B2B video?
Watch time and conversion are not the same objective, and conflating them is where most B2B video strategies break.
Watch time is a feed signal. LinkedIn uses it to decide whether to extend organic reach. For paid video, it affects your relevance score, which in turn affects your cost per impression. A video that holds 60% of viewers to the halfway point will typically cost less to distribute than one that loses 80% in the first ten seconds.
Conversion is a downstream event. It depends on offer clarity, audience temperature, and landing page alignment, not just creative quality.
The structural patterns that serve both goals:
- Captions on every frame. The majority of LinkedIn feed consumption happens without sound. A video without captions loses a large share of its potential audience before the message lands.
- Problem-first framing. Opening with the viewer's pain (not your product's name) keeps the 25% view-through rate high enough to matter.
- One action. "Book a demo" and "Download the guide" in the same video split intent and reduce clicks on both.
Runtime follows from objective. Awareness campaigns targeting cold audiences perform best under 30 seconds. Retargeting campaigns, where the viewer already knows the brand, can sustain up to 90 seconds for a product walkthrough or customer story. Beyond that threshold, completion rates fall sharply for most B2B segments, and the incremental information rarely justifies the drop.
The DSB Intelligence Recommendations Engine flags this kind of drop-off pattern early, identifying when a video creative is losing its audience between the 25% and 75% view milestones, and suggesting whether the issue sits in the hook, the middle, or the offer.
Why do most "creative examples" posts show you the wrong metric?
Most LinkedIn video ads roundups rank examples by view count, completion rate, or industry award. None of those metrics predict pipeline.
A video can accumulate millions of views and generate zero qualified leads. This happens constantly in B2B: a broad, emotionally resonant creative reaches a wide audience, earns strong engagement, and converts no one because the offer was never specific enough to move a buying decision.
The metric that matters is cost per pipeline-qualified lead, traced back to the creative. That number is almost never published in a "best examples" post, because it is proprietary and because it requires CRM integration that most marketing teams have not set up.
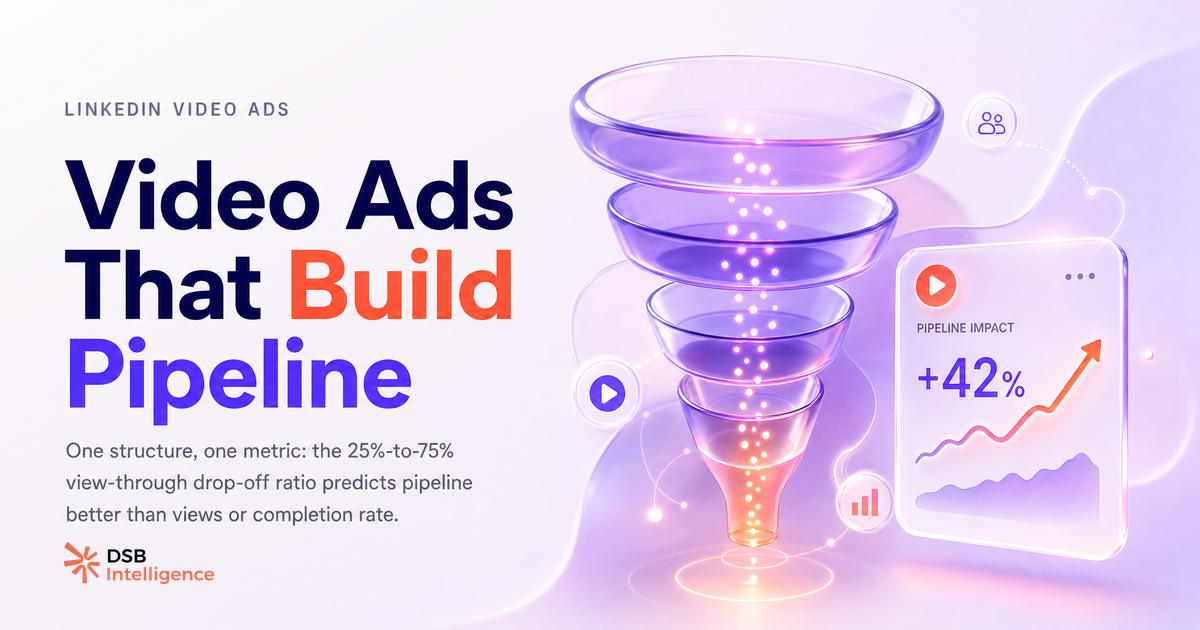
What you can use as a proxy: the 25%-to-75% view-through drop-off ratio. If 40% of viewers reach the 25% mark but only 8% reach the 75% mark, your hook is working and your message is not. That gap is where budget leaks. A well-structured video holds a tighter ratio between those two milestones.
This is also why copying a competitor's format without reading your own data is a losing move. Their audience, offer, and funnel stage are different. Their "winning" creative may be winning on a metric that has nothing to do with your objective.
For context on how organic and paid video interact on the same content, LinkedIn Thought Leadership Ads: the Organic-to-Paid Bridge covers the mechanics of boosting existing posts as sponsored content, a format that is quietly outperforming traditional video creative for cold audiences in several B2B verticals right now.
How do you read your own video ad performance before copying anyone else's format?
Before you look at a single external example, pull these four numbers from your own LinkedIn Campaign Manager:
- 25% view-through rate. This tells you whether your opening three seconds are working.
- 75% view-through rate. This tells you whether your message holds past the hook.
- Click-through rate on the CTA. This tells you whether your offer is compelling enough to act on.
- Frequency. This tells you how many times the same person has seen the ad.
The relationship between frequency and drop-off is where creative fatigue becomes visible. When frequency rises and your 25%-to-75% ratio worsens simultaneously, the creative is fatigued, not the audience. That is the signal to rotate, not to increase budget.
Most B2B LinkedIn audiences are small enough that fatigue sets in faster than on broader consumer platforms. A narrow segment of 30,000 to 80,000 people will exhaust a single creative in two to three weeks at moderate spend levels. Building a rotation of three to four short variants, each with a different opening frame but the same core offer, extends the effective life of a campaign without rebuilding the entire creative.
If you repurpose video content across formats, Download LinkedIn Video: What to Do With It covers the practical workflow for extracting and redistributing assets without losing quality.
Which formats are working in 2026, and which ones have quietly stopped converting?
The formats generating pipeline in 2026 for B2B LinkedIn sponsored video:
- Talking-head with captions, under 30 seconds. A founder or practitioner stating a specific problem and a specific claim. No production budget required. The authenticity signal outweighs the polish for most cold audiences.
- Screen-recording demo, 60 to 90 seconds, retargeting only. Works when the viewer already knows the brand. Fails on cold audiences because there is no established trust to carry the detail.
- Thought leadership ad format. Boosting an organic video post as sponsored content. The post's existing engagement acts as social proof in the feed. This format is outperforming standalone video creative for cold audiences in several B2B verticals, partly because it looks less like an ad.
The formats that have lost conversion efficiency:
- Heavily produced brand films (60+ seconds, cold audience). High CPM, low pipeline. The production quality signals "big company" but does not answer "why should I act now."
- Animated explainer videos with voiceover. These were effective in 2021 to 2023. Saturation has made them invisible in the feed. Viewers pattern-match them as ads immediately and scroll.
- Multi-CTA video. "Watch the webinar, download the report, or book a demo" in a single creative. Conversion splits across three actions and typically wins none of them.
For the broader context of how page-level strategy affects paid video performance, Company LinkedIn Page: Setup Is 20 Min, Strategy Is Forever covers the foundational decisions that determine whether your sponsored content lands on a credible page or an empty one.
And if you are still calibrating how discoverability signals interact with paid distribution, LinkedIn Hashtags in 2026: Do They Still Move the Needle? is worth a read before you finalise your campaign setup.
Now what?
- Pull your last three video campaigns in Campaign Manager. Calculate the 25%-to-75% view-through drop-off ratio for each. Rank them. The worst ratio tells you exactly where to fix the creative first.
- Audit your runtime distribution. If your cold-audience campaigns are running videos over 45 seconds, cut them. Test a version under 30 seconds with the same offer.
- Check your creative rotation frequency. If any ad has been running to the same audience for more than three weeks, build two new opening-frame variants before increasing budget.
- Before copying any external linkedin video ads examples, confirm the source metric. If the example is ranked by views or awards, discard it. If it comes with cost-per-pipeline data, study it.
Ready to track drop-off patterns and creative fatigue across all your LinkedIn campaigns in one place? Start your free trial of DSB Intelligence and connect your Campaign Manager in under five minutes.