

The agency that wins the renewal is rarely the one with the prettiest dashboard. It is the one that answered the client's actual question before the client thought to ask it.
That distinction is what most comparisons of online marketing reporting tools miss entirely.
Are most reporting tools actually built for agencies?
No. The dominant design assumption in digital marketing reporting tools is a single brand, a single team, and a single set of KPIs. That assumption breaks the moment you have twelve clients with twelve different definitions of "a good month."
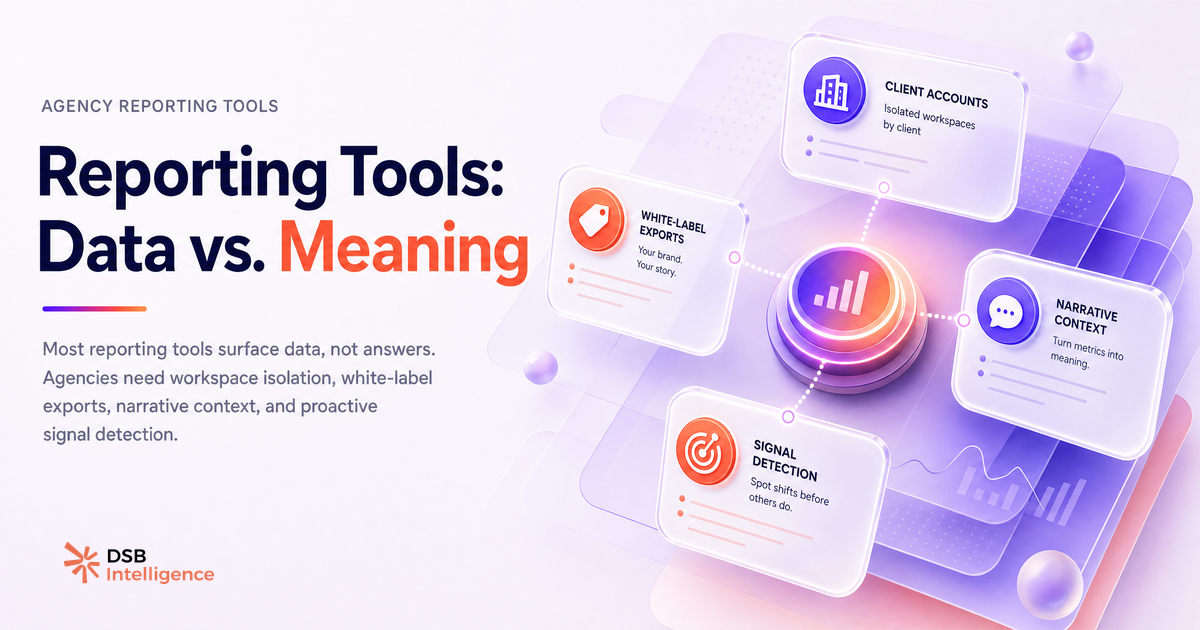
In-house teams need one coherent view of their own funnel. Agencies need something structurally different: isolated workspaces that prevent client A from seeing client B's data, white-label exports that carry the agency's brand rather than the tool vendor's, and a reporting layer that translates raw metrics into a narrative a non-technical client can act on.
Most tools were not designed with that last requirement in mind. They surface data. They do not surface meaning. The gap between those two things is where agency account managers spend their Sunday evenings.
The consequence is predictable. Agencies end up duct-taping three or four tools together: one for aggregation, one for visualization, one for PDF export, and a Google Doc for the actual narrative. That stack is fragile, slow, and impossible to hand off when someone leaves the team. For a deeper look at why these setups tend to collapse right before a client presentation, see Automated Reporting for B2B Agencies: Why Most Setups Break.
What are the 4 criteria that separate useful from expensive-but-pretty?
The market for client reporting software for agencies is crowded. Cutting through it requires a short, unambiguous filter.
Criterion 1: Multi-client workspace isolation. Can you guarantee that client A's data, users, and exports are structurally separated from client B's? Not just visually separated — structurally. This is a compliance question as much as a UX one, especially for EU-based agencies operating under GDPR.
Criterion 2: White-label exports. Does the report your client receives carry your agency's branding, or does it advertise the tool vendor? A PDF stamped with a third-party logo undermines the perception of proprietary methodology. It is a small detail that compounds over time.
Criterion 3: A narrative layer. Can the tool annotate, contextualize, or explain a metric shift? Or does it only display the number? The best marketing reporting tools for agencies are the ones that help you answer "why did this drop?" before the client asks. Without a narrative layer, every report is a data dump that requires manual interpretation.
Criterion 4: Proactive signal detection. Does the tool alert you when something meaningful changes, or do you have to log in and look? Reactive reporting is a liability in client-facing work. The agency that spots a trend before the client does earns trust. The agency that explains a bad month after the client noticed it first loses the renewal.
Most tools score well on two of these four. Very few score well on all of them. That is the honest framing for any comparison.
How does DSB Intelligence's Insight Narrator surface the signal clients actually care about?
The interpretation gap — between "here is the data" and "here is what it means for your business" — is where most automated marketing reports fall apart.
DSB Intelligence's Insight Narrator is built specifically for that gap. Rather than presenting a dashboard and leaving the narrative to the account manager, it reads the underlying signal pattern and generates a plain-language explanation of what changed, why it likely changed, and what the implication is. The account manager reviews, edits if needed, and sends. The Sunday-evening interpretation session shrinks to a quality check.
This matters most on LinkedIn analytics, where the metrics that correlate with pipeline outcomes (content reach among decision-makers, engagement from target accounts, share of voice in a niche) are rarely the ones a standard marketing analytics dashboard surfaces by default. Insight Narrator is designed to flag those signals, not just the vanity metrics that look good in a monthly PDF.
For context on what clients actually want from these reports, Marketing Agency Client Reporting: What Clients Want covers the expectation gap in detail.
Tool-by-tool breakdown: what does each one do well and where does it break?
Google Looker Studio is free, deeply flexible, and connects to almost any data source through native connectors or partner integrations. For agencies with a dedicated ops or data function, it is a strong foundation. The problem is that "flexible" means "requires configuration." Every new client account needs a new template, every new KPI requires a new calculated field, and every white-label requirement means a custom theme. The marginal cost per client is low once the system is built, but the fixed cost of building it is high. Smaller agencies billing under ten hours per client per month often find the setup investment does not pay back.
AgencyAnalytics solves the multi-client workspace problem cleanly. Each client gets an isolated environment, white-label options are built in, and the integration library covers the channels most B2B agencies manage. Where it breaks is on the narrative layer: the dashboards are well-designed, but they still require a human to translate the numbers into a recommendation. The tool tells you what happened. It does not tell you what to do about it.
Databox is strong on goal tracking and mobile-friendly dashboards. Its "Scorecards" feature is genuinely useful for weekly client check-ins. The weakness is depth: for agencies running complex multi-channel campaigns, Databox's data model can feel shallow. It is better suited to clients who want a simple traffic-light view than to clients who ask hard questions about attribution.
Whatagraph sits closest to the agency use case out of the box. Its report builder is fast, its white-label options are solid, and the visual output is polished enough to send without heavy post-processing. The trade-off is cost: at scale, Whatagraph's per-client pricing adds up quickly, and the narrative layer is still manual.
Supermetrics is not a reporting tool — it is a data pipeline. It moves data from platforms into Google Sheets, Looker Studio, or BigQuery. Agencies that already have a visualization layer and need clean, reliable data ingestion will find it indispensable. Agencies that want an end-to-end reporting solution will find it incomplete by design.
For a sharper look at where SEO-focused reporting tools specifically fall short, SEO Agency Reporting Software: What Most Tools Get Wrong is worth reading before committing to a stack.
The pattern across all of these tools is consistent: aggregation is a solved problem. Narrative and signal detection are not. That is where the differentiation lives, and it is where most B2B agency reporting workflows still rely on human judgment rather than tooling.
For a broader view of what a well-designed client reporting system looks like end-to-end, Client Reporting Systems: What B2B Teams Actually Need and Client Dashboard: Why Agency-Built Beats Vendor Portals cover the structural decisions in more depth.
When is no tool the right answer?
Sometimes the right deliverable is not a dashboard at all.
Three situations consistently call for a memo over a marketing analytics dashboard. First, when the client's goals have shifted mid-quarter and the existing KPI set no longer reflects what they are trying to achieve. A dashboard built on the wrong metrics is worse than no dashboard — it creates the illusion of measurement without the substance. Second, when the data volume is too low to be statistically meaningful. A LinkedIn campaign that ran for three weeks with a small budget will produce numbers that look precise but are not. Presenting them in a polished PDF does not make them more reliable. Third, when the relationship is early-stage and trust is still being built. In the first two months of a new client engagement, a well-written one-page analysis that demonstrates strategic thinking will do more for retention than any live dashboard.
The agencies that retain clients longest are not the ones with the most sophisticated reporting stack. They are the ones that know when to put down the tool and write a clear sentence.
Now what?
- Audit your current stack against the four criteria: multi-client isolation, white-label exports, narrative layer, signal detection. Score each tool honestly. The gaps will be obvious.
- Identify your actual bottleneck. If you spend more time aggregating data than interpreting it, the fix is a better pipeline (Supermetrics, Looker Studio). If you spend more time writing narrative than reviewing data, the fix is a tool with a stronger interpretation layer.
- Before adding a new tool, run one client account through a one-page memo format for a month. Measure whether the client engagement improves. The result will tell you whether your problem is tooling or communication.
- If LinkedIn analytics is part of your client mix and signal detection is your gap, start a free trial of DSB Intelligence to see how Insight Narrator handles the interpretation layer for you.