

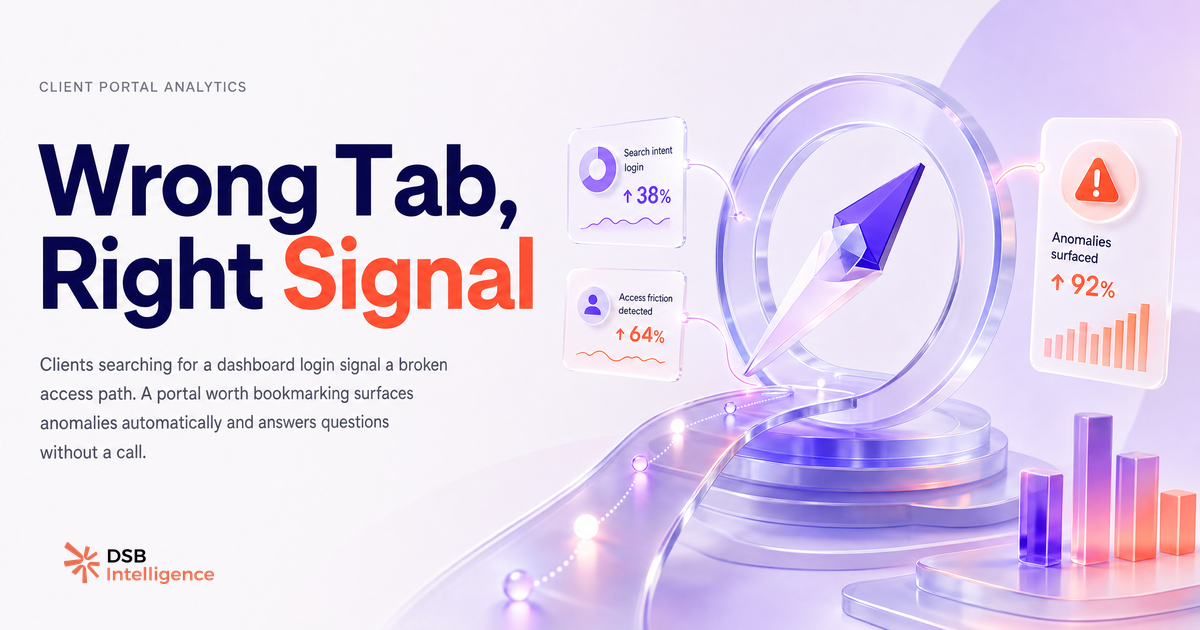
You landed here looking for the Alleviate client dashboard sign in app. This is not it.
DSB Intelligence is a LinkedIn analytics platform for B2B agencies and marketing teams. We have no connection to Alleviate Financial Solutions or its debt relief services. For the Alleviate login, go to alleviatefinancial.com or search "Alleviate Financial" in the Google Play Store or Apple App Store.
Now, if you have thirty seconds: the fact that you searched for a client dashboard login tells us something useful about what clients actually want from a portal. That part is worth reading.
Why do people search for a client dashboard sign in app instead of just bookmarking it?
Clients search for a dashboard login when the original access point has failed them.
The bookmark broke. The email with the link is buried. The app was never installed properly. Or, more often, the client was never given a clean, direct path to their data in the first place. They were handed a PDF at the end of the month and told "let us know if you have questions."
That is the real friction. A dashboard that requires a support request to access is not a dashboard. It is a reporting ceremony dressed up as transparency.
The pattern shows up across industries. Debt relief clients search for the Alleviate client dashboard sign in because they want to check their account status without calling. Marketing clients search for their agency's reporting portal because they want to see last week's LinkedIn numbers without waiting for the monthly deck. The underlying need is identical: autonomous access to data that is already theirs.
If you want to understand how agencies typically get this wrong, Client Dashboard Login: What Agencies Get Wrong breaks down the most common failure modes.
What does a client dashboard actually need to show?
A client dashboard needs to show the signal, not just the activity.
Most agency portals display volume: posts published, impressions delivered, reactions received. That is activity data. It answers "did we do the work?" It does not answer "did the work matter?"
The signal is different. It is the relationship between a content decision and a measurable outcome. Why did that post from Tuesday outperform everything else published that month? Was it the format, the topic, the timing, or the audience segment it reached? A dashboard that cannot answer that question is a scoreboard, not an analytical tool.
For LinkedIn specifically, the gap between activity and signal is wide. Impression counts are easy to surface. Dwell time distribution, share-of-voice by topic, or engagement rate segmented by follower seniority — those require a layer of interpretation that most vendor portals skip entirely.
The DSB Intelligence Insight Narrator exists precisely for this gap: it reads the pattern behind the numbers and surfaces a plain-language explanation of what drove a result, so clients do not need a data analyst on the call to understand their own performance.
For a deeper comparison of what agency-built dashboards can do that off-the-shelf vendor portals cannot, Client Dashboard: Why Agency-Built Beats Vendor Portals is the right starting point.
How is a navigational query like this one useful for agencies?
It is a signal about client trust, not a search mistake.
When a client cannot find their dashboard login, they search for it. That search is a data point. It tells you the onboarding failed, the UX created friction, or the client relationship is not sticky enough to keep the portal top of mind. Any of those is a problem worth diagnosing.
Agencies that track these navigational queries in their own analytics (via Google Search Console, for example) can identify exactly when clients disengage from a portal. A spike in branded dashboard login searches from organic traffic is a leading indicator of churn risk, not a vanity metric.
The same logic applies to debt relief platforms. When Alleviate Financial clients search for the Alleviate client dashboard login on Android or iOS, it means the app install flow did not stick. That is a product problem, not a user problem.
The lesson for any client-facing platform: the dashboard is not the product. The access path to the dashboard is part of the product. If clients cannot get in without friction, the data inside does not matter.
We explored a parallel case in Grow Therapy Client Dashboard: Wrong SERP, Right Lesson, where the same navigational pattern revealed a broader gap in how SaaS platforms think about client retention through data access.
What separates a portal clients return to from one they forget?
Clients return to dashboards that surface something new every time they open them.
A static PDF, by definition, offers nothing new after the first read. A dashboard that shows the same trailing-30-day averages without flagging anomalies or changes offers almost nothing more. The client opens it, sees numbers, closes it, and waits for the agency to tell them what it means.
The dashboards clients bookmark and check unprompted share three characteristics. First, they update frequently enough that checking in feels worthwhile. Second, they surface anomalies automatically — a post that significantly outperformed baseline, a drop in reach that started three days ago — rather than burying them in a table. Third, they let the client ask a question without scheduling a call.
That third point is the hardest to build and the most valuable to retain. It is also what separates a reporting portal from a decision-support tool.
For agencies managing asset-heavy or regulated clients, Client Reporting Asset Management: Beyond the Static PDF covers how to make the shift from periodic reporting to continuous data access without rebuilding your entire stack.
And if you want to understand how the debt relief sector handles (or mishandles) client data transparency, Freedom Debt Relief Client Dashboard: What It Shows and Hides is a useful reference point for what "good" looks like in a regulated, high-stakes context.
Now what?
-
If you need the Alleviate login: go to alleviatefinancial.com or search "Alleviate Financial" in your app store. You will find the sign in page directly.
-
If you manage client reporting for a B2B agency: audit your current portal against one question — can your client answer "what drove our best result last month?" without asking you? If the answer is no, the dashboard is doing less than half its job.
-
If you want to see what a LinkedIn analytics dashboard built for agency transparency looks like: start a free trial of DSB Intelligence and connect your first client account in under five minutes. No static PDFs. No monthly ceremony.