

Most LinkedIn creators celebrate a big impression number. They shouldn't — at least not without asking what's underneath it.
Impressions are the default metric LinkedIn surfaces — and the one most teams misinterpret. Understanding what impressions on LinkedIn means is the first step to building a content strategy that isn't flying blind.
What does "impressions" actually count on LinkedIn?
An impression is logged every time your post is rendered on screen. That's it.
No click required. No scroll-stop required. No minimum time in view. The moment your post enters someone's viewport — whether they're actively reading or just scrolling past at speed — LinkedIn counts it.
This has one important consequence: impressions are not unique. One person can generate five impressions on your post by opening their feed five times across the day. A post with 10,000 impressions might have been seen by 10,000 different people, or by 2,000 people an average of five times each. The raw number doesn't tell you which.
That ambiguity is not a bug in the metric. It's a feature — if you know how to read it. But most people don't, because they stop at the headline number.
How is "impressions" different from "Members Reached"?
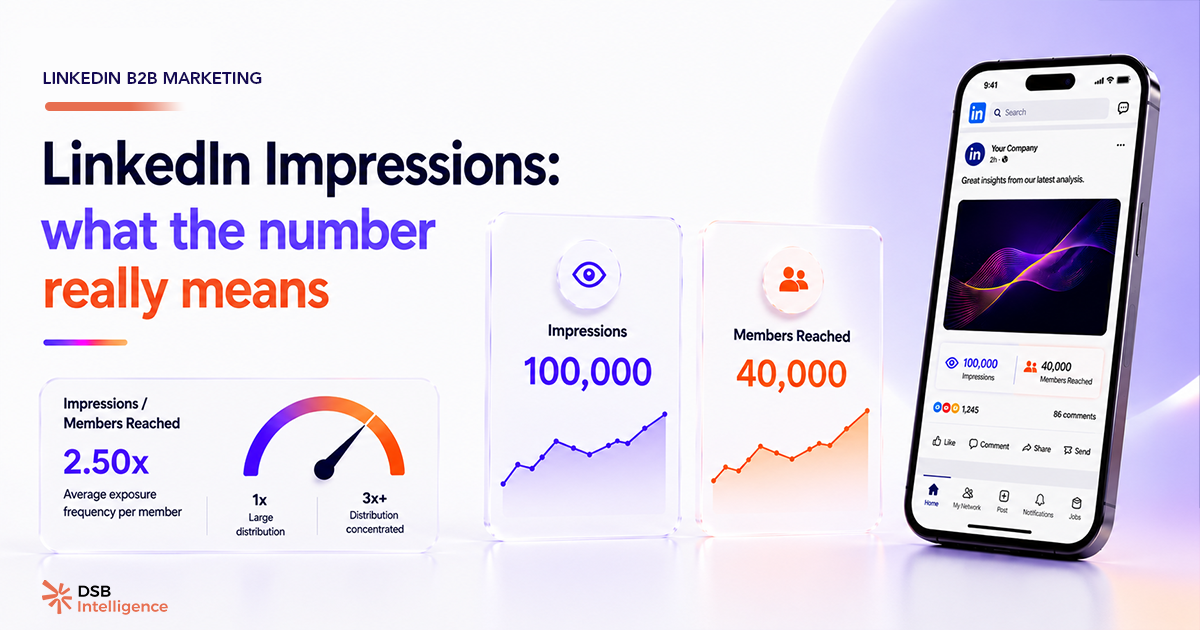
Members Reached is the count of unique LinkedIn accounts that saw your post at least once. Impressions is the total render count. The ratio between the two is your frequency.
If your post has 9,000 impressions and 3,000 Members Reached, your frequency is 3.0 — each person saw your post an average of three times. That's a meaningful signal. It means LinkedIn's algorithm kept re-serving the content to the same pool rather than expanding distribution to new accounts.
High frequency isn't always bad. For brand recall, repeated exposure has value. But for organic reach growth, a frequency well above 2 on a single post often means the algorithm tested your content, got a lukewarm response, and stopped pushing it to new audiences — so it recycled it to existing ones. In our view, this is one of the most underread signals in LinkedIn's native analytics.
The LinkedIn Impressions vs Members Reached: What the Gap Reveals breakdown goes deeper on how to interpret this ratio across post types.
Why does the LinkedIn feed algorithm use impressions as a signal?
LinkedIn's feed ranking system needs to decide, in real time, which posts to surface for each user. Impressions are one of the inputs it uses to calibrate that decision.
The early distribution window — the first hour or two after posting — is where the algorithm appears to run its first test. It pushes your post to a small slice of your network and measures the response. Engagement rate (reactions, comments, shares, clicks) calculated against those early impressions is the key signal it reads.
If that ratio is strong, the algorithm expands distribution. If it's weak, distribution stalls. This is why a post can accumulate impressions quickly and then plateau — the early signal wasn't strong enough to trigger the next distribution wave.
It's also why raw impression counts can be misleading. Take two hypothetical posts: one with high impressions but near-zero engagement, one with low impressions but strong engagement. The second is more likely to get pushed further. The first one is likely done.
For a fuller picture of what the algorithm actually rewards in 2025, LinkedIn Algorithm 2025: What It Actually Rewards covers the ranking signals that matter beyond impressions.
What does a declining impression trend actually signal?
A drop in impressions is one of the earliest detectable signals that something has shifted — either in your content, your posting behavior, or the algorithm's treatment of your account.
The mistake is to treat it as noise. A single low-performing post is noise. Three consecutive posts with declining impressions is a pattern worth investigating.
The causes fall into a short list: a hook that stopped working for your current audience, a posting frequency that outpaced your network's capacity to engage, a format shift that the algorithm is penalizing, or a genuine change in feed ranking logic. None of these are diagnosable from impressions alone — but impressions are the first number that flags the problem.
DSB Intelligence's Insight Narrator is built for exactly this moment: when you see the impression trend drop and need to know whether it's a content issue, a timing issue, or an algorithm shift — before it compounds into a reach collapse.
The What Are Post Impressions on LinkedIn — and What They Miss article covers the structural limits of the metric in more detail, including what it systematically fails to capture.
How should you actually use impressions in your content analytics?
Impressions are a necessary input. They are never sufficient on their own.
The correct way to use them is as the denominator in your key ratios. Engagement rate on impressions (not on followers) is the only version of the metric that reflects real feed performance. Click-through rate on impressions tells you whether your content drives action beyond passive exposure. Reach rate — Members Reached divided by your follower count — tells you how far outside your immediate network the content traveled.
These ratios turn impressions from a vanity number into a diagnostic tool. A post with 20,000 impressions and a 0.2% engagement rate is underperforming. A post with 3,000 impressions and a 5% engagement rate is a signal to study and replicate.
One more thing worth flagging: impressions include renders from your profile page and from direct shares, not just feed distribution. If a post gets significant traffic from profile visits — because you linked to it in a comment or a DM — the impression count will be inflated relative to organic feed reach. LinkedIn doesn't break this down by source in its native analytics. That's a known blind spot, and it matters especially if you're running paid amplification alongside organic content — a dynamic explored in LinkedIn Advertising B2B: Why Your Campaigns Underperform.
Understanding LinkedIn.com/feed Is Not an RSS Feed also helps frame why distribution is never guaranteed — and why impressions are an outcome of algorithmic decisions, not a passive count of subscribers.
Now what?
- Pull your last 10 posts and calculate frequency for each (impressions ÷ Members Reached). Flag any post where frequency exceeds 2 — that's your recycled-distribution signal.
- Recalculate your engagement rate using impressions as the denominator, not follower count. The number will look smaller. That's the real number.
- Look for three consecutive posts with declining impressions. If you find that sequence, investigate hook performance and posting cadence before blaming the algorithm.
- Track reach rate (Members Reached ÷ followers) alongside impressions. It tells you whether your content is escaping your immediate network or staying trapped inside it.
If you want these ratios calculated automatically and surfaced as actionable signals, try DSB Intelligence free — no credit card required.