

Your agency's tool stack probably has fifteen platforms in it. Your client report cites three of them.
That gap is not a workflow problem. It's a strategy problem, and it compounds every quarter.
Are most agency tool stacks built for operations, not for client proof?
Yes, and the reason is structural. Tools get added to solve execution problems: a scheduler for social, a crawler for SEO, a bid manager for paid. Each one is justified at the time of purchase by an operational need. None of them are evaluated on whether they help you explain results to a client.
The outcome is a stack that runs campaigns efficiently and reports on them poorly.
This is not a niche complaint. The pattern shows up consistently across agency categories: digital marketing agency tools are selected by the team that uses them, not by the person who has to defend the results in a quarterly review. The client never sees most of the stack. They see a PDF or a Looker Studio dashboard, assembled from a fraction of the data your tools produce.
If you want to audit your own stack, the test is simple: for each tool you pay for, ask whether its output appeared in a client-facing report in the last 90 days. Most agencies find that fewer than half their platforms pass that test. The rest are operational infrastructure that generates data nobody cites.
That's not inherently wrong. Operations matter. But it means your reporting stack is much smaller than your tool stack, and you should be building and evaluating it separately.
What's the reporting gap: what clients actually ask vs. what your dashboards show?
Clients ask about outcomes. Dashboards show activity. That's the gap, and it's wider than most agencies acknowledge.
A client running a B2B LinkedIn campaign doesn't ask "what was our average engagement rate?" They ask: "Are we reaching the right people? Is this moving pipeline?" Those are different questions, and the standard dashboard doesn't answer them.
The problem is that most marketing reporting tools are designed to aggregate data across channels and display it in a consistent format. Consistency is useful internally. It becomes a liability in a client meeting when the consistent format shows metrics the client doesn't understand or doesn't care about.
Impressions, reach, and engagement rate are activity metrics. They describe what happened on the platform. They don't describe what happened in the client's business. The translation between those two layers is where most agency reporting breaks down.
The agencies that retain clients longest are the ones that make that translation explicit, in writing, every month. Not "here are your numbers" but "here is what the numbers mean for your next decision." That requires a narrative layer in your stack, not just a data layer. Read more on what that looks like in practice in Marketing Agency Client Reporting: What Clients Want.
How does closing the LinkedIn analytics blind spot change what agencies can report?
LinkedIn is the most common analytics gap in a B2B agency stack. Native LinkedIn analytics give you impressions, clicks, follower growth, and demographic breakdowns. That's useful for monitoring. It's not enough for reporting.
What's missing: content-level performance patterns, audience signal depth, and the kind of trend analysis that lets you say "this content format is consistently outperforming for this audience segment, and here's why we think that." LinkedIn's native interface doesn't surface that. Most third-party tools in the standard agency stack treat LinkedIn as a secondary channel and pull only the metrics the API exposes at the surface.
The result is that agencies managing LinkedIn for B2B clients can show that posts went out and got some engagement. They can't explain what's driving the variance between posts, or which signals indicate the audience is actually warming up.
This is the blind spot that DSB Intelligence's Insight Narrator is built to close. It reads the patterns underneath the surface metrics and produces a structured narrative: not just "engagement was up 18% this week" but "the spike is concentrated in this audience segment, driven by this content type, and the trend is consistent enough to act on." For agency teams managing multiple LinkedIn accounts, that narrative layer replaces the manual interpretation work that currently sits between the data pull and the client slide.
For a broader look at how LinkedIn analytics fit into an agency reporting workflow, Social Media Manager Tools: The Agency Stack That Works covers the channel-level decisions in more detail.
What are the four categories that belong in a reporting-first stack?
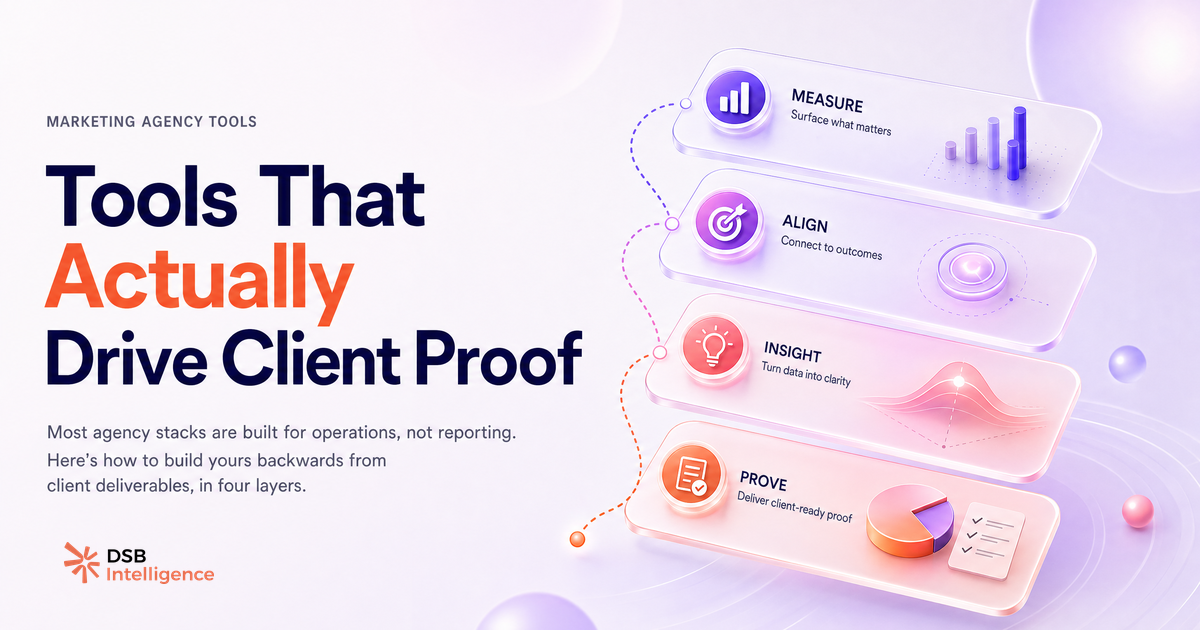
A reporting-first stack is built backwards from the client deliverable. Start with the questions your clients ask. Work back to the data that answers them. Select tools that produce that data in a format you can narrate. Everything else is optional.
The four categories that belong in every agency reporting stack:
1. Unified analytics layer. One platform that aggregates cross-channel performance data and lets you build client-facing views without manual exports. GA4 plus Looker Studio covers most agencies. The goal is a single source of truth for web and campaign data.
2. Channel-depth tools. For each channel where your client has significant investment, you need a tool that goes below the surface metrics. For SEO, that's a crawler plus a rank tracker. For paid, it's the platform's native reporting plus a bid intelligence layer. For LinkedIn B2B, it's a dedicated analytics tool that surfaces content and audience signals the native interface doesn't expose. Generic aggregators don't replace channel depth.
3. Narrative layer. Something that translates data into language. This can be a human process (a structured template your team fills in) or a tool that generates the interpretation. Either way, it has to exist. A dashboard without a narrative is just a spreadsheet with better formatting.
4. Client-readable delivery format. The output your client actually opens. This might be a live dashboard, a PDF, a slide deck, or a structured email. The format matters less than the constraint: it must be readable by a non-analyst in under five minutes. If your client needs a 30-minute briefing to understand the report, the format is wrong.
Anything outside these four categories is operational. Keep it if it helps you run campaigns. Don't count it as part of your reporting infrastructure.
For a more detailed breakdown of how these categories map to specific tools, Marketing Agency Tools in 2026: Track These 4 Signals goes deeper on what to measure within each layer.
When does a bigger stack make your reporting worse, not better?
When each new tool produces its own data format and requires manual reconciliation, the reporting burden grows faster than the insight does.
This is the failure mode that most agencies hit between year two and year three. The stack has grown to cover every operational need. The reporting workflow now requires pulling exports from six platforms, reconciling numbers that don't match because of attribution differences, and assembling a narrative from data that was never designed to be combined.
The analyst who used to spend two hours on a client report now spends six. The extra four hours go to data wrangling, not interpretation. The report gets longer. The insight gets thinner.
The fix is subtraction before addition. Before evaluating any new marketing agency tool, run the 90-day citation audit described above. Remove or deprioritise any platform whose data doesn't appear in client reports. Then evaluate whether the gap you're trying to fill is a data gap (you don't have the signal) or a narrative gap (you have the data but can't explain it). Most agencies find it's the latter. Adding another data source doesn't fix a narrative problem.
SEO Agency Reporting Software: What Most Tools Get Wrong covers this dynamic specifically for SEO agencies, where tool sprawl is a particularly common pattern.
The agencies that report well don't have the most tools. They have the clearest constraint: every platform in the stack has to earn its place in a client deliverable, or it gets cut.
Now what?
- Run the 90-day citation audit on your current stack. List every tool you pay for. Mark which ones produced data that appeared in a client report in the last 90 days. Anything unmarked is a candidate for removal or deprioritisation.
- Map your stack against the four categories above. Identify which category is weakest. For most B2B agencies, it's the channel-depth layer for LinkedIn or the narrative layer.
- Fix the narrative layer first. If your reports show data but don't explain what to do with it, no amount of additional data will fix client satisfaction. Build or adopt a structured interpretation template before adding new sources.
- Close the LinkedIn blind spot specifically. If LinkedIn is a significant channel for any of your clients and you're relying on native analytics, you're reporting on a fraction of what's actually happening.
Start a free trial of DSB Intelligence and see what the Insight Narrator surfaces from your clients' LinkedIn data in the first session.