

Most agency reporting workflows have the same hidden cost: a strategist spending six to ten hours every week assembling data that already exists, in tools that already talk to each other, into a format that will be read for four minutes and then archived.
That's not a data problem. It's a workflow design problem.
The agency reporting trap: what does "more tools, less signal" actually mean?
The trap is structural. Every new client channel adds a new data source. Every new data source adds a new login, a new export format, and a new reconciliation step on Monday morning.
By the time an agency manages eight to fifteen clients across LinkedIn organic, paid social, SEO, and email, the reporting stack has become a patchwork: Google Sheets pulling from Looker Studio, which pulls from connectors that break on API version updates, which feed into slide decks that someone still reformats by hand.
The irony is that adding more tools to fix this usually makes it worse. A new dashboard platform means another data sync to maintain. A new visualization layer means another place where numbers can silently diverge from the source.
The agencies that escape this trap do one thing differently: they define the reporting architecture before they sign the next client, not after. See Marketing Agency Tools That Actually Drive Client Proof for a breakdown of what a lean, scalable stack looks like in practice.
Signal gets buried under volume. Clients receive more data and less clarity. The strategist who should be advising on next quarter's content direction is instead explaining why the impressions number in the deck doesn't match the number in the platform.
What does automation actually remove from your workflow, and what stays manual?
Automation removes the assembly layer. That's the majority of the time cost, and it's worth being precise about what it covers.
Data ingestion is fully automatable: pulling reach, engagement, follower delta, click-through, and conversion data from connected platforms on a defined schedule. Formatting is largely automatable: populating a template with the right numbers, applying client-specific branding, generating comparison periods. Delivery is fully automatable: sending the report at a fixed cadence without a human triggering it.
What automation does not remove is interpretation. A client whose LinkedIn follower growth slowed by 30% in Q2 needs to know why, not just that it happened. That "why" requires context: did they reduce posting frequency? Did a competitor launch an aggressive organic campaign in the same niche? Did the content mix shift away from formats that historically drove follows?
That interpretive layer is where agency value lives. Automating the assembly work is precisely what creates the time to do it well.
There is also a category of reporting tasks that automation handles poorly by design: what clients actually want from reporting is often not a faster version of the same report — it's a clearer answer to "are we making progress?" That question requires judgment, not just data retrieval.
How does DSB Intelligence's Insight Narrator turn raw LinkedIn data into client-ready narrative?
LinkedIn organic data is structurally harder to automate than paid data. Paid platforms expose clean, standardized metrics with well-documented APIs. Organic LinkedIn performance involves signals — content velocity, audience quality shifts, post-level dwell patterns — that are not natively exportable in a format ready for client reporting.
The gap between "data available" and "insight deliverable" is where most agency LinkedIn reporting stalls. The raw numbers come out of the platform. Someone still has to write the sentence that explains what they mean.
DSB Intelligence's Insight Narrator closes that gap by generating the narrative layer directly from the ingested data. Rather than producing a table of metrics that a strategist then annotates manually, it produces a structured interpretation: which signals moved, in which direction, and what the likely implication is for the next content cycle. The output is client-ready text, not a prompt for more analysis work.
This matters specifically for agencies managing multiple LinkedIn-heavy B2B accounts, where the bottleneck is not access to data but the time cost of contextualizing it per client, per week.
What does a reporting stack that scales without adding headcount actually look like?
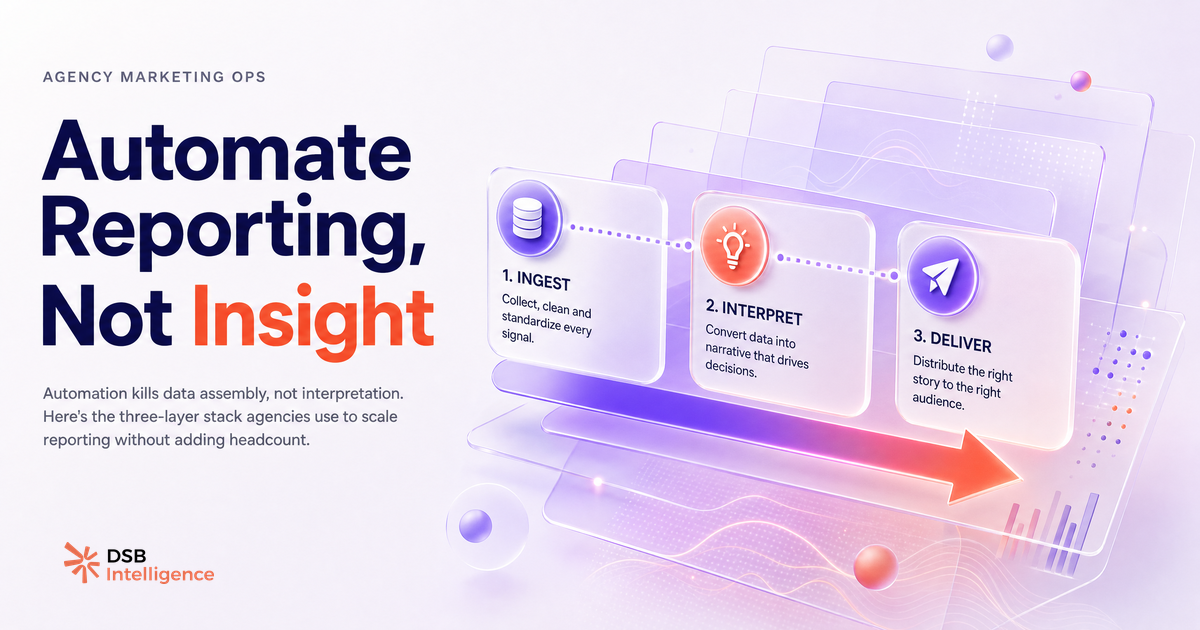
The agencies that scale reporting without hiring more analysts share one structural choice: they treat the reporting stack as three distinct layers with clean handoffs between them, not as one monolithic tool.
Layer 1 — ingestion. A single pipeline that pulls from all connected platforms on a schedule. No manual exports. No CSV uploads. If a connector breaks, it alerts; it does not silently produce wrong numbers.
Layer 2 — narrative. An interpretation layer that translates metric movements into account-specific commentary. This is the layer most agencies skip or handle manually, and it's where the time cost compounds fastest at scale.
Layer 3 — delivery. A formatting and distribution layer that outputs the report in the client's preferred format (PDF, live link, slide deck) and sends it on the agreed cadence.
Tools that try to do all three in one interface tend to do none of them well. The ingestion is rigid, the narrative is generic, and the delivery is inflexible. The better architecture picks a best-in-class tool for each layer and connects them with clean data contracts.
For the delivery layer specifically, online marketing reporting tools for agencies covers the current options worth evaluating, including white-label considerations covered in depth in White Label SEO Reporting: What Agencies Actually Need.
When does automation break down: which edge cases are worth knowing before you commit?
Automation handles stable, well-defined metrics reliably. It breaks down at the edges, and those edges are predictable enough to plan for.
Custom attribution windows are the most common failure point. A client who wants to measure LinkedIn-influenced pipeline with a 90-day lookback window and offline touchpoints included is asking for something that no standard connector handles out of the box. Automation can get you 80% of the way; the last 20% requires a custom data model.
Mid-contract KPI changes are the second. A client who redefines "engagement" from reactions-plus-comments to comments-only halfway through a quarter breaks every automated comparison period in the report. The fix is contractual as much as technical: lock KPI definitions at onboarding and version them explicitly when they change.
Multi-brand account structures are the third. An agency managing three sub-brands under one client umbrella, each with its own LinkedIn page and its own content strategy, needs reporting that can aggregate and disaggregate cleanly. Most tools aggregate well; disaggregation with consistent attribution is harder.
One additional edge case specific to LinkedIn: automation tools that interact with the platform programmatically carry compliance risk that paid-data connectors do not. LinkedIn Automation Tools in 2026: What the SERP Won't Tell You covers where that line sits and which tool categories sit on the wrong side of it.
Knowing these failure modes before you build the stack means you design around them rather than discover them during a client review.
Now what?
- Audit your current reporting cycle: log every manual step from data pull to client send. The steps that take more than 15 minutes and repeat every week are your automation targets.
- Separate your stack into the three layers (ingestion, narrative, delivery). If one tool is doing all three, identify which layer it handles worst — that's your first replacement candidate.
- Lock KPI definitions in writing at the start of every new client engagement. Automation breaks on ambiguity; clear definitions are the prerequisite, not the afterthought.
- For LinkedIn organic specifically, test whether your current stack produces account-specific narrative or just formatted numbers. If it's the latter, that's the gap to close first.
Ready to stop annotating dashboards and start shipping client-ready LinkedIn insight automatically? Try DSB Intelligence free and see what Insight Narrator produces on your actual account data.